Page 10

What AT IS SAYING:NAS100

Trader 1 · July 8, 2026
General

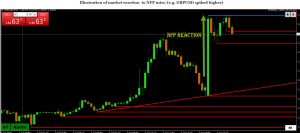
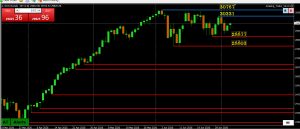
AT (Amazing Trader 4 hour chart shows bounce from a new low at 28676 would need to regain 29200+ to neutralize the last leg down or risk stays on the downside..

Otherwise, focus stays on 29K as a pivotal level as NAS100 facess headwinds from tech and geopolitics.
Read more »

WHAT AT IS SHOWING: EURUSD

Trader 1 · July 8, 2026
General

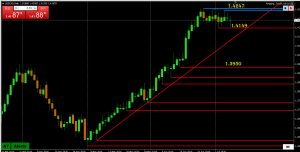
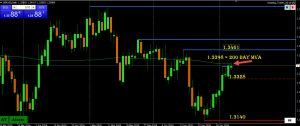
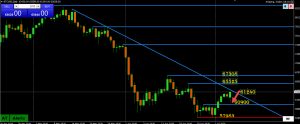
AT (Amazing Trader) 4 hour chart shows blue lines dominating, indicating momentum on the downside.

However, so far unable to shake a focus from 1.14, which has limited the move (low 1.3193).

Read more »

WHAT IS AT SHOWING:US500 (SP500)

Trader 1 · July 8, 2026
General

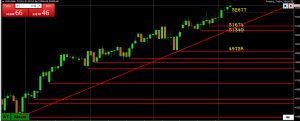
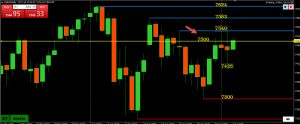
AT (Amazing Trader) 4-hour chart shows risk on the downside (2 blue lines) that have so far seen a 7426 target hit (low 7420)

Price action suggests risk the 6 day pivot around 7500 would be broken tomorrow (unless it trades), a bearish signal but only a break of 7420 would build further momentum.,

Read more »

WHAT IS AT SHOWING: USDJPY

Trader 1 · July 8, 2026
General

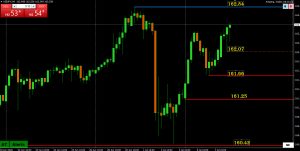
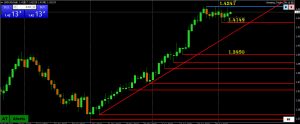
AT (Amazing Trader) 4 hour chart shows rising red support lines = upward momentum.

Supports at 162.07 and 161.66 keep risk pointed up, stronger if the former holds as support.

Read more »

WHAT AT IS SHOWING: XAUUSD (GOLD)

Trader 1 · July 8, 2026
General

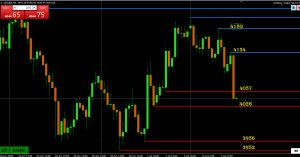
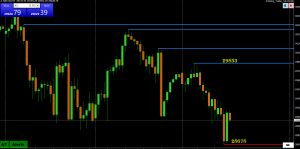
AT (Amazing Trader) 4 hour chart shows XAUUSD back on the defensive with 4027 the last line of defense ahead of 4000 and key 3956 and 3942. While bull sentiment is shaken by the failure at 4200 and subsequent retreat, damage is not fatal unless the 3942 low is broken.

Back above 4057 would cool the risk but only back above 4134 would fully negate current momentum.

Read more »

GLOBAL MARKET UPDATE: RISK OFF

Trader 1 · July 8, 2026
General

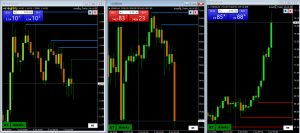
EURUSD                                                                        US500                                                          XTIUSD

Risk off takes over with oil and US bond yields spiking higher, US bond yields USD firming while stocks and GOLD tumble. The catalyst was President Trump saying the Iran ceasefire is over “I think.”

Read more »

US30 (DJIA) DAILY CHART OUTLOOK

Trader 1 · July 7, 2026
General

US30 momentum: Strong up as it continues to benefit both from rotation (e.g. when tech stocks wobble) and when equities rally in general. (usually with a lag).

When in uncharted record high territory the only resistance is the new record high (53244).

Read more »

USDCAD DAILY CHART OUTLOOK

Trader 1 · July 7, 2026
General

Itching for a breakout.

Current pattern: 1.42 has traded in each of the past 11 days (including today). The longer this pattern goes on the greater the risk of a directional move in the direction of the breakout once the pattern ends.

Read more »

BTCUSD DAILY CHART OUTLOOK

Trader 1 · July 6, 2026
General

Pause above the former mini breakout level at 60900 (low 61240) should be encouraging to the bull side but requires a trendline break and solid move above 65K for momentum to build to the upside.

Otherwise, 60-61K/64-65K range.

Read more »

NAS100 DAILY CHART OUTLOOK

Trader 1 · July 6, 2026
General

While the bounce from just below 29K is encouraging, a solid move above 30K is needed to put the bulls back into control.’

Otherwise, it is still consolidation while trade is between 29-30K.

Read more »

USDJPY DAILY CHART OUTLOOK

Trader 1 · July 6, 2026
General

USDJPY is trading back above 162 with its 40 year high at 162.84 looming above.

This has raised the risk of BoJ intervention, where its tactics have changed from verbal warnings => then actual intervention to no warning => ambush with covert intervention to keep traders off guard and guessing.

Read more »

US500 (SP500) DAILY CHART OUTLOOK

Trader 1 · July 4, 2026
General

Current pattern: 4 days pivoting 7500, rewarding range traders at the expense of those looking for a breakout.

In any case, the longer the pattern goes on the greater the risk of a directional move (in the direction of the breakout)  once it is broken.

Read more »

Is the bottom in?

3 green up candles and signs of momentum on short-term time charts are encouraging signs but a solid move above 4200-20+ followed by breaks of the daily trendline and 4381 would confirm the shift in risk.

Read more »

EURUSD DAILY CHART OUTLOOK

Trader 1 · July 4, 2026
General

Signs of a bottom (higher lows: 1.1361/1.1324)  that would need to take out 1.1622 to confirm the low in in.

This leaves room to trade within the broader trend where 1.1473 (also 50% of 1.1622 => 1.1324)) and 1.1508 (61.8%)  would need to be solidly regained to give legs to run this higher.

Read more »