…
Comes into the day where 1.4200 has traded 12 days in a row.
While a break of this pattern (meaning 1.42 doesn’t trade) would send a bearish signal, it would only be confirmed if the 1.4149 bottom of the range is firmly broken.

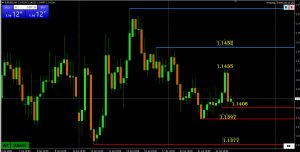
As you will see in an upcoming blog article the “50” level (e.g. 1.1450) can be a powerful sentiment indicator, especially for short-term trading.
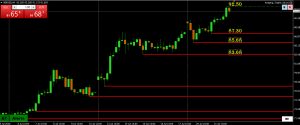
This is why the pause at 1.1449 caught my eye as it was not only around a chart resistance, but it was 1 pip shy of 1.1450.

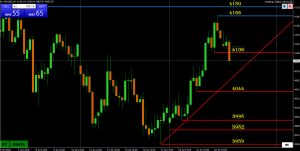
Pause above 4000 has cooled the downside but to break/reverse current momentum 4134 needs to be firmly broken.

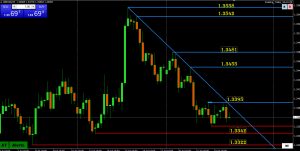
AT (Amazing Trader) daily chart shows momentum building to the upside following breaks of 1.3398 (200 day mva) and this week’s 1.3401 high, so far with limited follow through.
For momentum to build further, 1.3461 would need to be taken out.

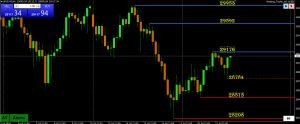
AT (Amazing Trader 4 hour chart shows bounce from a new low at 28676 would need to regain 29200+ to neutralize the last leg down or risk stays on the downside..
Otherwise, focus stays on 29K as a pivotal level as NAS100 facess headwinds from tech and geopolitics.

AT (Amazing Trader) 4 hour chart shows blue lines dominating, indicating momentum on the downside.
However, so far unable to shake a focus from 1.14, which has limited the move (low 1.3193).

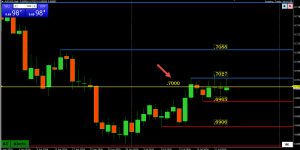
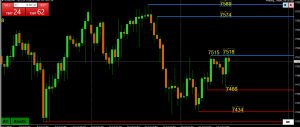
AT (Amazing Trader) 4-hour chart shows risk on the downside (2 blue lines) that have so far seen a 7426 target hit (low 7420)
Price action suggests risk the 6 day pivot around 7500 would be broken tomorrow (unless it trades), a bearish signal but only a break of 7420 would build further momentum.,

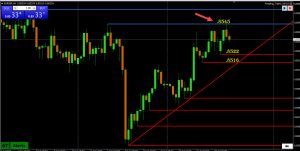
AT (Amazing Trader) daily chart shows 1,42 trading for the 12th day in a row.
Range over this period have been 1.4149-1.4247.