
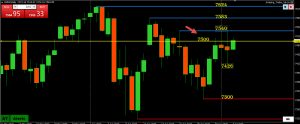
Current pattern: 4 days pivoting 7500, rewarding range traders at the expense of those looking for a breakout.
In any case, the longer the pattern goes on the greater the risk of a directional move (in the direction of the breakout) once it is broken.
Trigger on the upside would be a firm break of 7540.
On the downside, 7426 needs to hold for a higher low.
Note, this chart is from a CFD feed, which can vary between brokers, even with the same symbol. Same for CFDs vs. cash of futures prices. However, while your levels may differ from this chart, the patterns you see should look similar on your chart.
Test Plugin
Add comment