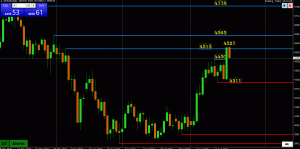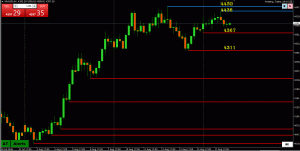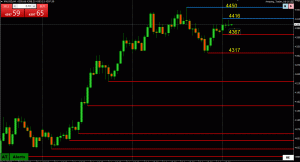
Break of a 5-day pattern around 7500 sends a bearish signal and now dependent on 7375 (Thursday low) holding TO AVOID PUTTING 73000 ON THE RADAR.
Moves to the upside should be limited unless 7500+ trades again

Break of a 5-day pattern around 7500 sends a bearish signal and now dependent on 7375 (Thursday low) holding TO AVOID PUTTING 73000 ON THE RADAR.
Moves to the upside should be limited unless 7500+ trades again

Break of 6 day pivot around 29K is a bearish sign if confirmed today.

The focus of all global markets remains on the price of crude oil, specifically Brent oil (Sept) and the $100 level. The move below $100 (last 97.70) today has eased some of the pressure on global markets but so far just enough to steady the ship, not reverse it
The chart displayed here is a CFD chart with a different price feed but the AT lines on it should coincide with what you see on your charts.
Coming into the day, AUDUSD .7000 has printed 7 days in a row. To extend this pattern to 8 days, .7000 would need to trade again today. If not, break of the pattern would be typically bearish but in this case, only if the low is taken out.
Range over this period has been .6962-.7127, low set yesterday.
(AT daily chart)

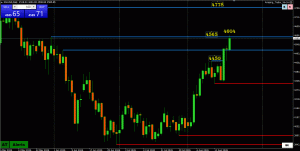
Pause yesterday above 4000 (low 4021) contained the downside but little to go for unless it trades outside of a 4000-4100 range.
From a broader perspective, for momentum to build, 3021 needs to hold followed by a brerak ofg 4166.

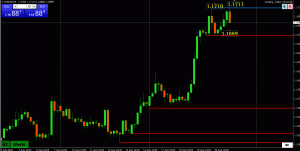
Pause yesterday above key 1.1361 support (low 1.1364) keeps the focus on 1.14, which would need to be regained to neutralize the downside risk (high so far today 1.1401)..
Keep one eye on the price of Brent oil, which has slipped back below $100 (the key focus), easing some of the pressure on global markets in general after spiking/closing above it yesterday.
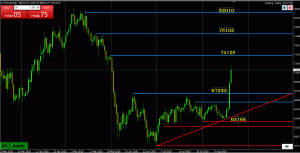
Turning defensive after failing to test 67K but for down momentum to take control, 63685 eould need to be broken.
(AT 4 hour chart)

On the defensive as well while below 29K, not as pivotal as US500 7500 but a level that has traded 6 days in a row.
Should thgis pattern be broken tomoirrow, mit would send a bearish signal that would need to be confirmed by a firm break of 28000-28200.

On the defensive while below 7500, a level pivoted in each of the past 5 days.
Should this pattern be broken tomorrow, it would send a bearish signal that would need to see 7420 broken to confirm…

If trading GBPUSD and/or EURUSD, especially the former as market has more trouble absorbing that side of the cross, don’t ignore EURGBP.
I suggest reading our blog article, Understanding Cross-Currency Flows, and then look at this EURGBP chart.
Note how selling pressure eased on GBPUSD and EURUSD lost its bid after EURGBP held a test of key .8545 resistance.