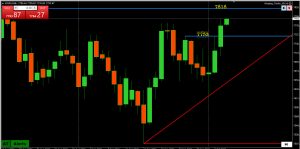

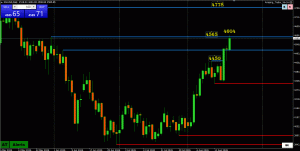
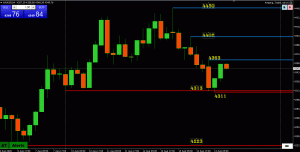
Chart shows potential for a low but for serious momentum to build, 4227 would need to be firmly taken out.]
Otherwise, risk wopuld shift back to a 4100-4200 range.
Chart shows potential for a low but for serious momentum to build, 4227 would need to be firmly taken out.]
Otherwise, risk wopuld shift back to a 4100-4200 range.
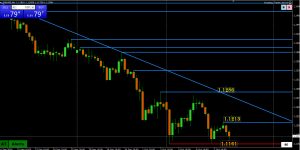
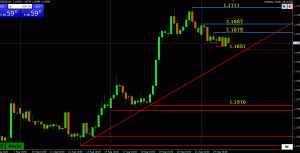
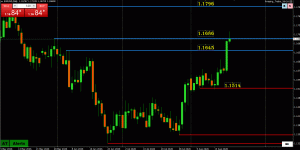
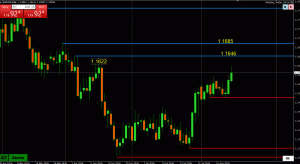
Focus remains on 1,12 to set the tone with trade below it exposing the 1.1161-64 (higher) lows but consolidating (with no stops to run) while above it.
On the upside, above 1.1213 would be needed to build some momentum the other way and postpone the risk.

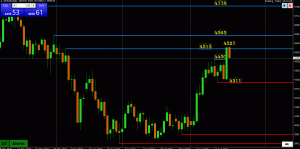
When you see 3 blue at lines drawn off a high (red lines drawn off a low) it is often followed by an acceleration in the direction of the lines.
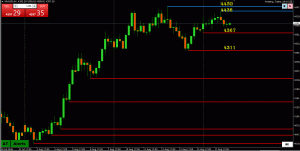
Thi has seen US500 extend its slide where 7750 stands in the way of opening the door to 7700-07.

While betting against stocks has been a losing wager, can’t ignore what charts are showing, which is 2 blue AT lines drawn off the new record high indicating a potential top (ir pause) and shift in risk towards a retracement.
With no key supports nearby that would need to be broken to confirm a shift in risk, keep an eye on 7800, which needs to hold to contain the downside.

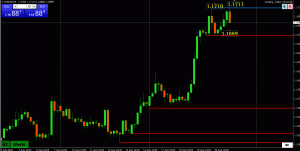
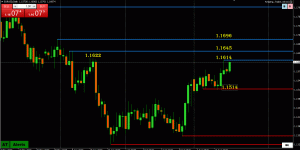
Fresh test of the downside after pause below 1.1286 would need to take out the 1.1161 low to break fresh ground and open the door to the long standing 1.1065 target.
Otherwise, range is intact and focus stays on 1.12 to set its trading bias.
Break of an 8-day pivot around 7700 yesterday sent a bullish signal that has seen 7753 (on this CFD chart() broken, which puts the record high at 7818 on the radar as long as it trades above it.
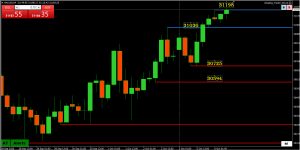
New record high leaves a void of key levels as it trades in uncharted territory.’
Besr guess for the next pivotal target level would be 31500-32000 so keep an eye on 31k, which needs to hold as support to keep moimentum for this new leg up goimg.

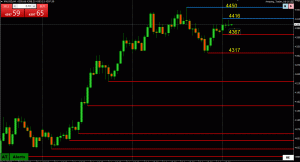
With rally attempt stalling below 4235, subsequent retreat dependent on 4110 holding to keep the downside in check.
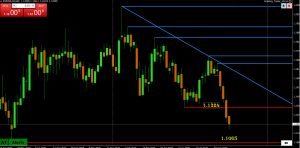
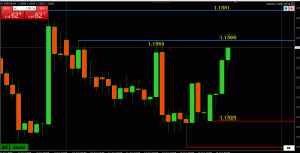
It has been a bumpy road in the direction of 1.1065, cited as a potential target following the break below 1.1500-10 and then confirmed after 1.1324 was solidly broken.
Will it be tested?
Trend: up
Momentum: Short-term down
Trend UP
Momentum: UP
Trend: up
Trend: up
Momentum: up
Trend UP
Momentum: UP
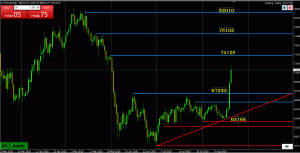
Extending breakout through a 2+ month high and now depende3nt on staying above 67230 to maintain a bid targeting 74K+ although 70K+ needed to make it a strong bid.
(AT daily chart)
Trend UP
Momentum: Cooled?
Trend: up
Momentum: up
Trend: up
Momentum: up
Trend UP
Momentum: Stalled by a lower high
Trend: Up
Momentum: Up
Trend: up
Momentum: up
Trend: up
Momentum: Turning up
Trend UP
Momentum: Correcting
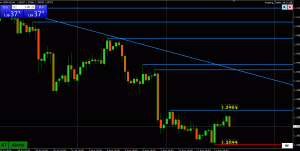
Trend: Down
Momentum: Consolidating
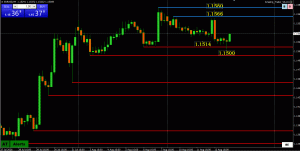
Trend: up
Momentum: Stalled
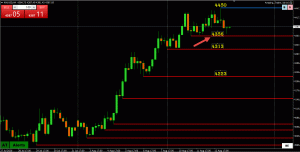
Trend UP
Momentum: UP
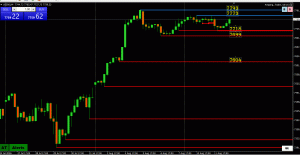
Trend: Major Up
Momentum: Consolidating with a bid
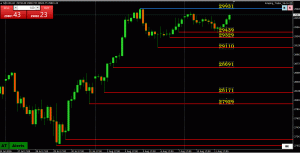
Trend: Short-term up
Momentum: Up but still below 30K
Trend up
Momentum Up
Trend UP
Momentum: UP
Trend: Struggling to build momentum up
Momentum: Stalled
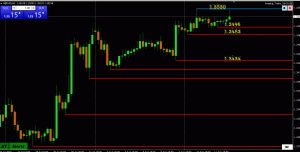
Post-US CPI: Watch 1.1550 as a sentiment indicator as it has flipped between support and resistance the past fews day.