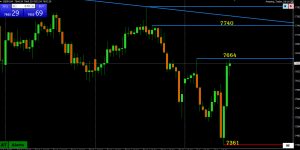
US500 is trying to put in a bottom at 7295.
Two rising red Amazing Trader lines at 7325 and 7348 flagged a potential bottom.
Weekly, daily and intraday levels for forex, indices, gold and crypto, with the key support and resistance to watch before you trade.
US500 is trying to put in a bottom at 7295.
Two rising red Amazing Trader lines at 7325 and 7348 flagged a potential bottom.
Gold (XAUUSD ) is trying to build fresh upside momentum, with rising red Amazing Trader (AT) lines marking higher lows.
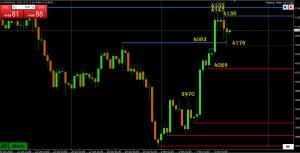
4138 would be the first test.
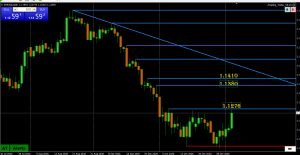
EURUSD has bounced to 1.1194, just shy of the pivotal 1.1200 level.
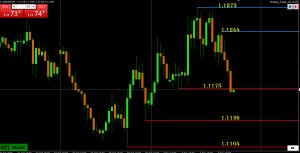
Friday’s break below the red Amazing Trader (AT) line at 1.1136 failed to follow through, with the selloff stalling at 1.1131, above the key 1.1104 low.
Hawkish BoJ Minutes
The yen is the forex story to watch this morning. USDJPY traded near 158.25 early in the Asian session. Earlier, the yen firmed 0.5% to 157.70 per dollar after the Bank of Japan minutes.
Asian Stocks Rebound
Asian stocks bounced on Monday after a rough week for AI names. Japan’s Nikkei 225 closed 2.3% higher at 58,775.50, and Taiwan’s Taiex jumped 4.9%. However, the Kospi slipped 0.8% to 5,018.85, while the Hang Seng edged up 0.1%.
BTCUSD DAILY OUTLOOK: Battle for 75,000
Daily momentum still points down. The blue Amazing Trader (AT) lines at 84,840, 81,864 and 81,214 mark a series of lower highs.
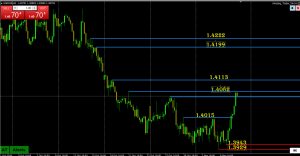
AUDUSD’s failure to hold above .7000 has shifted risk to the downside. The daily Amazing Trader (AT) chart shows two lower blue resistance lines off the .7067 high..
Friday’s break below .6894 and a key .6864 daily support at .6832 in focus. If that level gives way, .6800 is the next round-number.
The daily trend remains down while EURUSD holds below 1.1277. On The Amazing Trader chart, the blue resistance lines have stepped lower since August.
The latest blue line at 1.1277 is also around a key four-hour level (1.1273), making it the one to watch for a change in the daily trend.
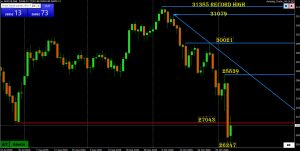
NAS100 is bouncing from 26247, but the daily chart still shows a pattern of lower highs and lower lows following the decline from the 31385 record high.
27043 is the immediate pivot. The latest candle traded above it but is back below it in this snapshot.
Here are the XAUUSD weekly levels after a lively week for gold. First, price dipped to 3880 early on, then rallied to 4147 before sellers stepped back in.
It now trades near 4062. However, the rebound looks good on the surface, but the weekly trend still points down.
Here are the EURUSD weekly levels as the pair heads into the close on the back foot. EURUSD spiked to 1.1273 this week but could not hold it.
However, by Friday afternoon it was back near 1.1150, leaving a long upper wick on the weekly candle. As a result, that shape usually tells you sellers are still in control.
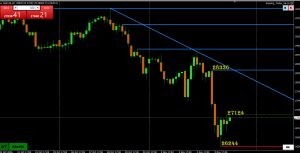
While the bounce from a 26244 low to 27000 (high 27124) providing some relief,, it would take a move back above 28000, the 4 hour trendline and 28336 to make itmore than a retracement.
On the downside, deck is cleared of stops until the 26233 low.
One pattern worth noting is that a move often accelerates after a third AT line (blue nor red blue), especially drawn off the high (or low) turns solid (see chart)
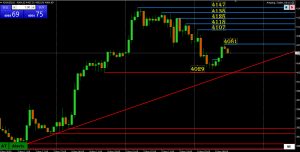
In this case, a series of blue lines (lower highs) above 4100 have capped the upside but so far, a pause above 4029 keeps a bid and avoids a shift back to 4000.
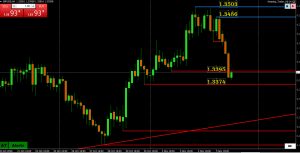
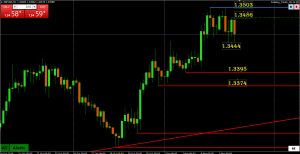
A failure at 1.35 has seen GBPUSD retreat test and so far pause in the 1.3374-95downsidse risk contasin support zone.
A firm break would end the upside risk.
EURUSD back to opening week levels where a break of 1.1175 negates up momentum but needs to become resistance to expose 1.1136 and the 1.1104 low pn the downside.
If not, then 1.12 remains pivotal with a limit on the upside while below it.
Classic Amazing Trader (AT) reversal pattern
With GBPUSD finding 1.35 tough and a lower high, 1.3444 would need to be taken out to build momentum to the downside.
Otherwise, is 1.3444 needs to hold followed by a break of 1.3503 to signal a fresh leg up.
Benefiting from risk off and lower US bond yields as US stocks meltdown but so far not by enough to take out 3166 (and 4200) targetrs.
This can go two ways:
One look at this chgart will tell show you the importance of the 27000 area (broken) as below it is a black hole of support.
The only level worth noting is the trendline and it is more of a referencer level rather than strong support.
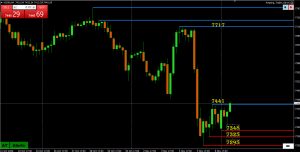
Following the NAS100 plunge that has so far avoided fatal damage with a pause above the 7461 low.
While a bounce back above 7500 would slow the risk, 7622+ would need to be regained to negate it.
I call it the chart of the day as it highlights why we call The Amazing Trader and its levels
amazing.”
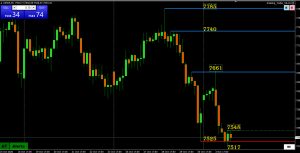
Post-US midterm whipsaw has broken down momentum but so far upside paused just shy of 7664, a pivotal resistance that would need to be broken to open the door to 7700, which is also around the 61.*% FIBO level.
Regaining a bid above 1.1200 but faces resistance at 1.1276, pausing so far just below it (1.1373).
If broken, targets are at 1.1324 (former breakout level), 1.1380-1.1410.
For a new lower high (7661) followed by a new low (7517) to signal a new down leg 7525 (former low) would need to becoime resistance followed by a firm break of a long standing target at 7505 (and confirmed by a firm break of 7500).
If not, then back above 7550 would cool the risk while above 7661 would be needed to shift it.
This is a crucial time for the AT XAUUSD 4 hour chart,
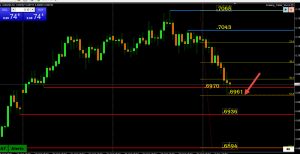
2 blue AT lines drawn off the .7068 high indicated a shift in risk to the downside which paused 1 pip above .6960 = 61.8% reracement (of .6894 => .7068) after running stops below .6970.
While momentum is still pointed down, if .6960 holds then focus stays on .7000.
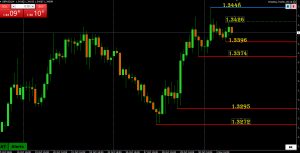
Cnsolidating after yesterday;s 1.3448 high capped the upside and then lost steam
To indicate the high is in at 1.3448 or at least a pause, 1.3374 would need to be broken.
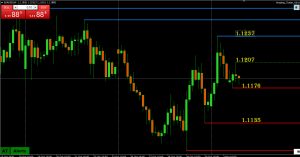
Broad range is 1.1136-1.1237 with a tighter one today at 1.1176-1.1207
While the midpoint of the broader range is at 1.11865, the 1.12 level will eventually set its tone,
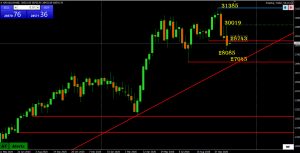
While the pause above the key 28000 round number will have positive implications if it holds (keeps 27000 off the radar),, at a minimum, NAS100 would need to move back above 28743 (28820 on shorter term charts) to be back into its old range.
What I am watching is how it ends the week to see if a battern of 3 red (down) candles is extended or broken.
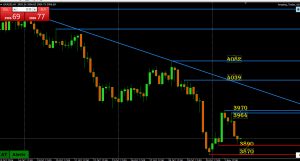
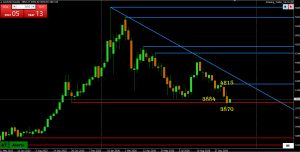
With the break of key 3884 support (low 3870), not holding, a case can be made for at least a pause.
To make it more than just a pause and indicate a low is in for now, a firm break back above 4040-82 would be needed.
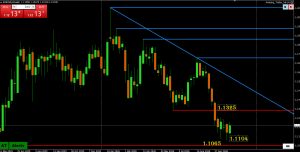
Weekly chart shows support above the key 1.1065 level has led to a pause but with the former support/breakdown level at 1.,1325 still some distance away, keep an eye on 1.12 as that will ultimately dictate whether the low is in and risk has shifted.
Shorter-term charts show a higher low (1.1136) with momentum trying to build to the upside where 1.1200 needs to hold to keep the current bid.’
A meltdown in metals has seen XAUUSD plunge through 3900 but pause (low 3891) just above key weekly support at 3884.
One look at this chart shows the signficance of 3884 as there is a giant void below it.\
Double top around 30000 has NAS100 on the defensive and dependent on 29132 holding to keep the downside contained by a higher low.
ABove 29132 trade is consolidating. while a firm a break would exposae the 28820 low.
Bounce off 1.1105 (200 week mva) after stops run belpw 1.1113, shifts the focus to 1.1170 but only above it would see an outside day that would break down momentum.
However, to turn the risk the other way, 1.1195-00+ would be needed.
For the double bottom at 1.1113 to be more than a pause, EURUSD would need, at a mnimum, to move back above 1.1150 to slow the move but only back above 1.12 woulkd say the low is in for now.
Taking a broader the long standing Amazing Trader target remains aT 1.1065, currently protected by the 1.1113 double bottom.
Two hurdles today for NAS to build on its current rebound
For NAS100 to make this more than a retracement and shift risk to the upside, a break of 29935, key 4 hour trendline and most important to confirma solid move above 30000.