
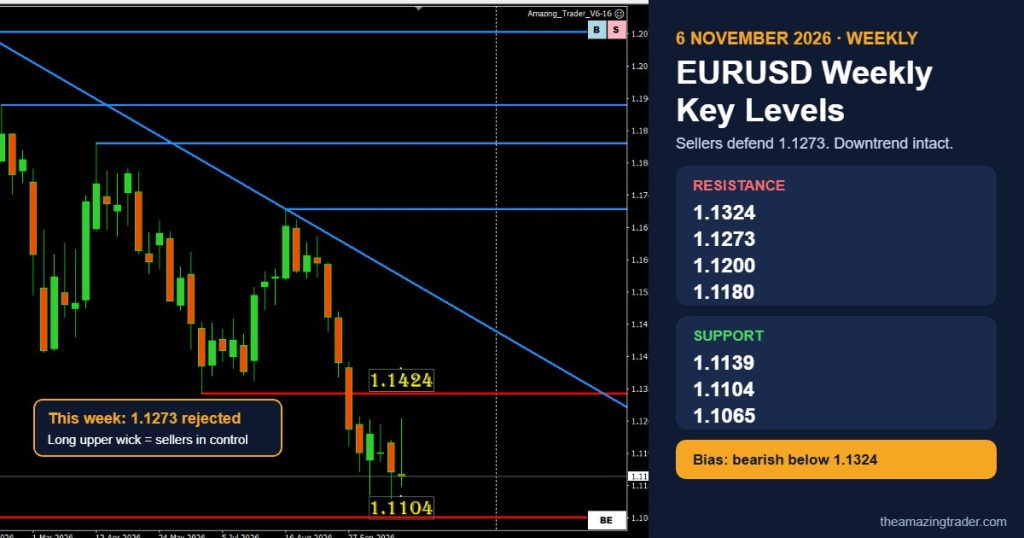
Here are the EURUSD weekly levels as the pair heads into the close on the back foot. EURUSD spiked to 1.1273 this week but could not hold it.
However, by Friday afternoon it was back near 1.1150, leaving a long upper wick on the weekly candle. As a result, that shape usually tells you sellers are still in control.
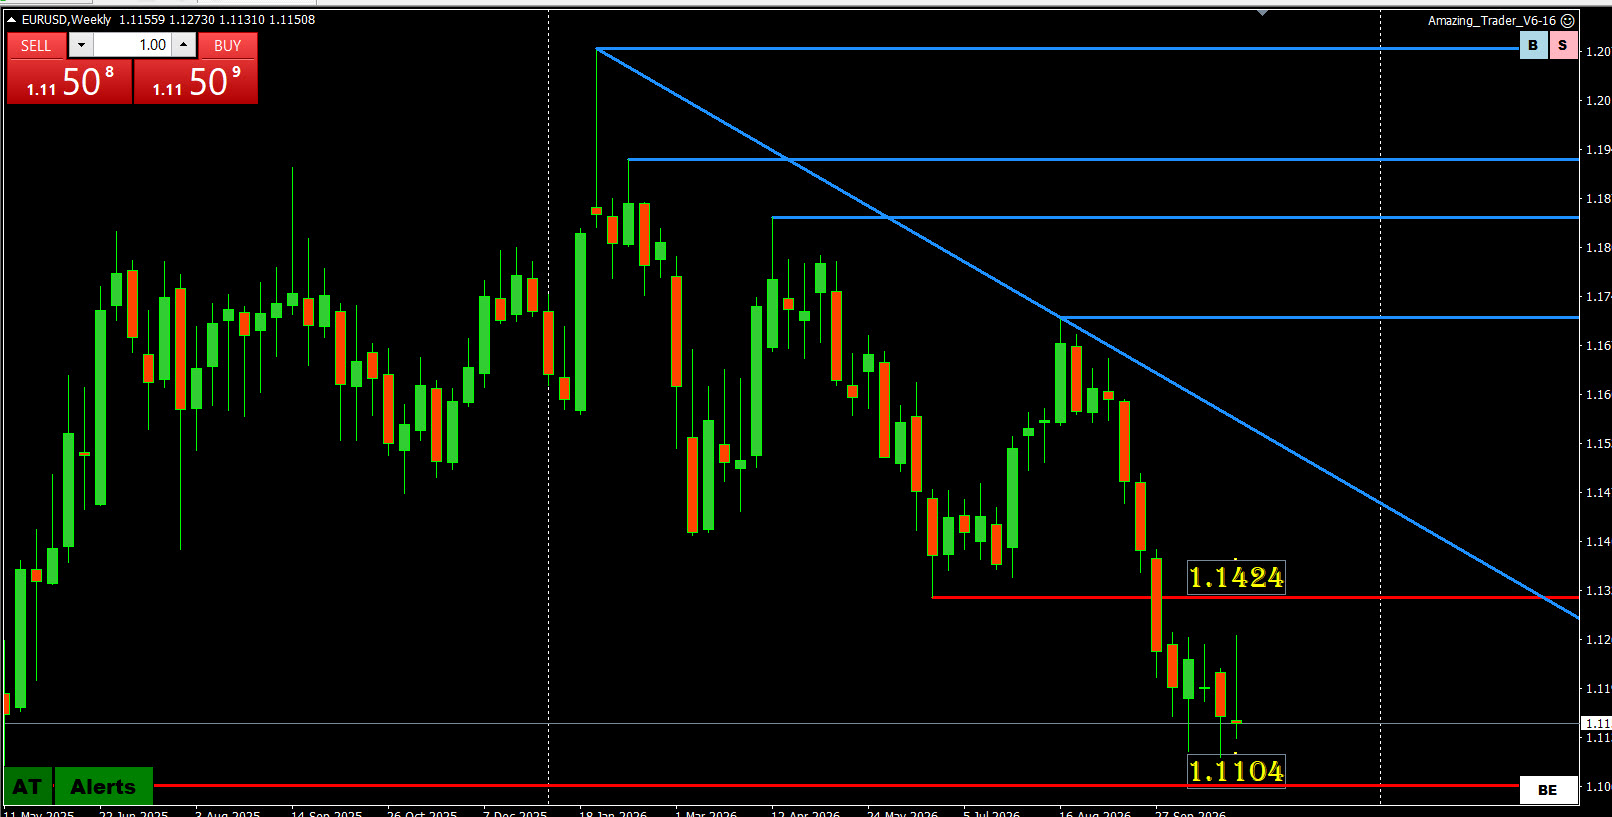
The bigger picture has not changed. Since the January high near 1.2000, the weekly chart has printed a run of lower highs along a falling trendline. In fact, every bounce this year has been sold. Then the autumn slide below 1.14 sped things up, and the last six weeks have been a slow grind lower.
EURUSD weekly levels: resistance
- 1.1180 – first hurdle, just above the current price
- 1.1200 – round number and minor congestion
- 1.1273 – this week’s high, the spike that failed
- 1.1324 – the key level; a weekly close above it would be the first real sign of a turn
EURUSD weekly levels: support
- 1.1139 – first support, just above this week’s 1.1131 low
- 1.1104 – the recent swing low marked on the chart
- 1.1065 – next stop if 1.1104 gives way
How to trade it
While EURUSD stays below 1.1273, rallies into 1.1180–1.1200 look like selling opportunities. On the other hand, a weekly close below 1.1104 would open the way to 1.1065, and probably lower. In short, bulls need a close above 1.1324 before they can talk about a bottom.
Weekly levels give you the map. For timing, drop to the lower timeframes, as explained in Drill Down Trading. The blue lines on the chart come from The Amazing Trader indicator, which flags direction changes on any timeframe.
Watch how the week finishes. A close near the lows would confirm the rejection candle and set up another test of support. Keep an eye on the US data calendar and any comments from the ECB. After all, either can move this pair fast.
As always, size your positions sensibly and use stops. Also, our 10 rules of risk management cover the basics. For more short setups, see the latest Daily Tips.