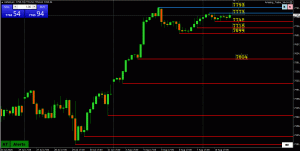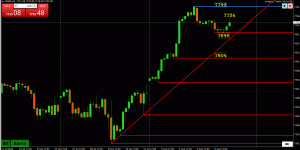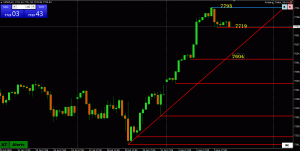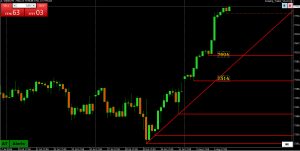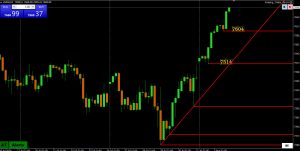
US500 spike higher following tame US core CPI would need to take out 7582 to build momentum on the upside.
Otherwise, dependent on 7500 holding as support to keep a bid.

US500 spike higher following tame US core CPI would need to take out 7582 to build momentum on the upside.
Otherwise, dependent on 7500 holding as support to keep a bid.

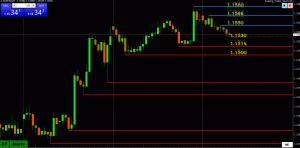
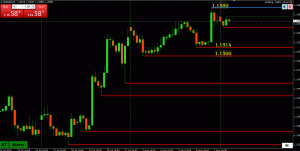
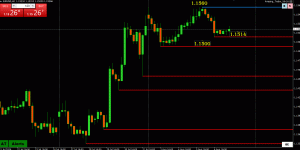
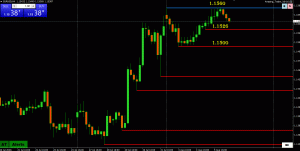
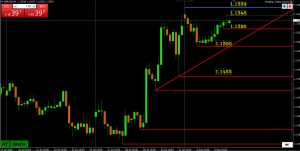
Post CPI pop would need to take out 1.1462 (tested) and 1.1473 (also 50% of 1.1622 => 1.1324) to put 1.;15 and 1.1508 (61.8%) on the map.
Otherwise, focus stays on 1.1450 to set its intra-day tone but with a limit on its downside while above 1.1430.

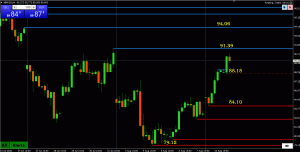
The move above 78.83 on this CFD chart) confirms the break of downward momentum and the low is in for now.
With next key levels far away, it likely leaves a focus on $80 to set its tone.

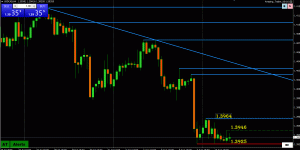
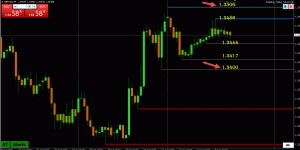
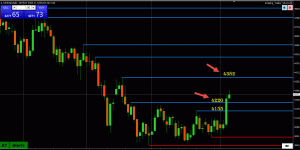
Pause above 1.3322 support so far checking downside but to negate current down momentum that started with last week’s 1.3451 high, 1.3412 (blue AT line) would need to be broken.
This leaves GBPUSD consolidating with a weaker EURGBP providing some support.

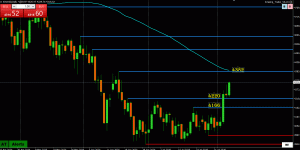
While up momentum is building on other time frame charts, the daily chart shows .5864 as the level that would need to be broken to break the back of the downtrend and confirm the low in in.
Otherwise, upside will be contained but still keep a bid as long as it trades above .5743 (4-hour support).

There are times when pivotal round number prove to be more important in setting trader sentiment than any specific chart point.
One of those pivotal levels is XAUUSD 4000, with a bounce Back above it following a pause above 4060 3960 and 3942 supports has cooled the downside risk but not negated it.

USDCAD building momentum to the downside following
While trade is below 1.4150, potential targets are 1.4000 and 1.3950.

USDCHF on the verge of testing its near one year high (.8170). If broken, next key level is .8476.
Key weekly (buy on dips support ) .7910

Higher low would need to be followed by a break of $78.83 (on this CFD chart) to indicate a low is in and break current momentum.
Line up your chart to see a similar \pattern as levels likely differ from this CFD chart

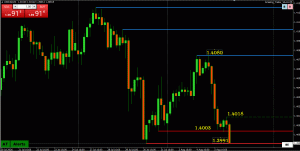
Turning bearish after Friday’s break of a 12-day pattern pivoting 1.42.
For momentum to build to the downside, 1.414, the 12-day range bottom needs to become resistance. Some caution as USDCAD has been unable to distance from it.

Consolidating below Friday’s 7583 high and dependent on 7500-05 holding as support to keep a bid and momentum pointed up.
Intra-day low so far 7520

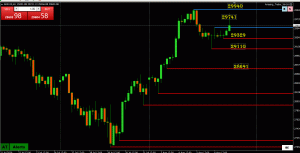
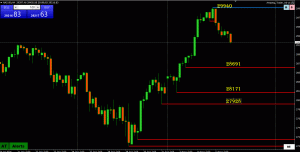
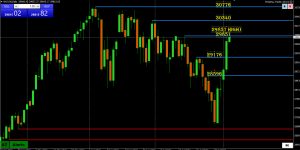
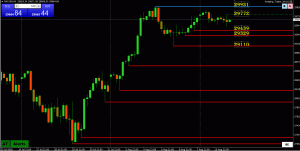
Consolidating after failing to break 29853 (on this CFD chart), needed for momentum to build further for a run back to 30K.
This leaves it dependent on 29334 holding to keep the downside in check and prevent a shift in risk back to 29K and 28678 low.

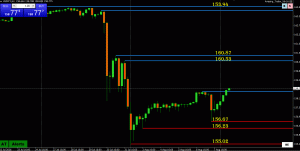
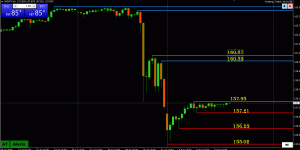
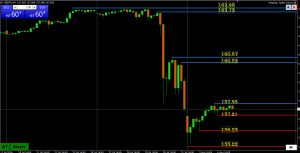
What stands out on this chart is a bounce from a double bottom just above 161.25 support.
On the other side, for momentum to buil;d to the upside, 161.80 needs tyo hold as support followed by a break of 162.25.

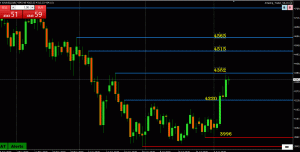
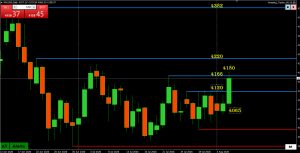
On the defensive while below 4100 but to build further momentum to the downside, 4022 would need to be firmly broken (low so far 4044).
On the other side, 4120-38 would need to be regained to restore a bid and shift the focus back to 4200.

Bounce off the low more than filling the opening week gap but so far with limited follow through as it consolidates within its existing range (e.g. key supports 1.1361 and 1.1324)
Key resistance levels are clear on this chart, 1.1462 and 1.1473 (also a 50% retracement). To challenge these levels, 1.1450+ would be needed (note high today 1.,1446). Suggests upside is limited unless 1.1450+ trades.

No change to this view: For momentum to build to the upside, 61215 needs to hold followed by a break above 65525.
Otherwise, it stays stuck in a range within -60/61-64/65.


Currently pivoting 4100 as it trades within a 4022-4202 range.
While upside is capped below 4138, attempts build up momentum will struggle, making it dependent on 4054 holding to keep those hopes alive.

7 day pivot around 7500 likely to be broken = bullish
Now needs to firmly trade above 7552 to confirm, which would expose 7583 as the last obstacle to the record 7624 high

12-day pattern around 1.42 so far broken (bearish if 1.42 doesn’t trade today)
1.4149 range low over this 12-day period broken as well (stops run) but with limited follow through after a pause above 1.4134 support (low 1.4136) and 1.4124 below it. This is why I say AT levels matter.
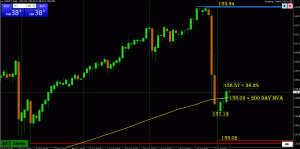
USDJPY fell back below 162 after Finance Minister Katayama said pension funds should be encouraged to invest more in the domestic market.
So far key support at 161.25 has held (low 161.28) to contain the fallout but only back above 162.00 and 162.07 would negate the shift in risk.
Market stays in a sell on blips mode while trade is below 162.

It is said that the forex market (and its algos) live to run stops. This can be seen by this chart where stops were run above 1.1449 followed by a pause just below 1.1462 and a quick retreat. Key resistance (also a 50% retracement).is at 1.1473
Momentum otherwise is tilted up but with little to go for on the upside (i.e. no key stops to run) unless the high of the day (1.1461) is taken out.

If you are looking for momentum to build, 61215 needs to hold followed by a break above 65525.
Otherwise, it stays stuck in a range within 60/61K – 64/65K

US500 has seen 7500 print for the 7th day in a row. To break the pattern and put bulls back in control, 7500 needs to become support.
Note, the longer a pattern like this goes on the greater the risk of a directional move in the direction of the breakout.

NAS100 an outperformer with rebound off the low needing to regain 29852 and then 3K+ to negate the downside risk and put the bull camp back in control.
(AT 4 hour CCFD chart)
…
Comes into the day where 1.4200 has traded 12 days in a row.
While a break of this pattern (meaning 1.42 doesn’t trade) would send a bearish signal, it would only be confirmed if the 1.4149 bottom of the range is firmly broken.