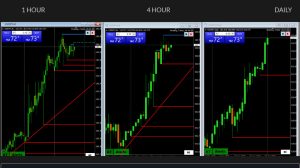
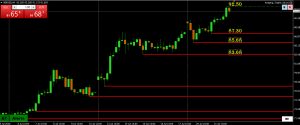
Chart is clear;
Momentum up
Chart is clear;
Momentum up
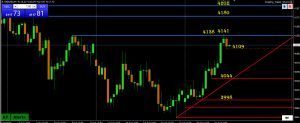
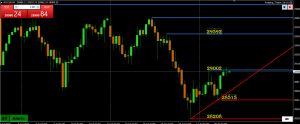
Momentum up, 4138 target hit (high 5151)
If 4138 is firmly broken, then target shifts to 41.80-4202
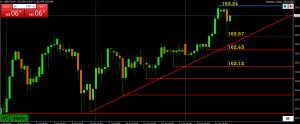
Under normal conditions, USDJPY would be looking to accelerate the upside.
However, threat of BoJ intervention makes this a not normal market and at a minimum, slkows e pace..
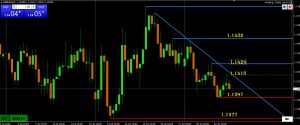
Momentum pointed down but without much enthusiasm unless 1.1400 and 1.1377 are firmly broken (low 1.1397).
On the upside, 1.1429 break would be needed to negate current risk.
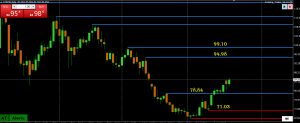
With down momentum broken following the move above 78.84 (on this CFD chart), battle is on for 85.00, above which is needed to give it psychological boost as there is a void of key resistance above it (high 85.66).
Key an eye on correlations as so far only the USD has reacted with US stocks, GOLD, and BITCOIN so far ignoring.
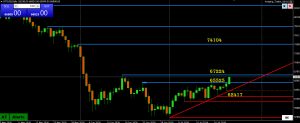
Break and close above 65525 would be considered a breakout that would need to get through 67224 (leave a cushion to above 68K to confirm) to open a void on the upside.
On the downside, back below 65525 *(leave a cushion back below 65K ro confirm) to cool the risk.
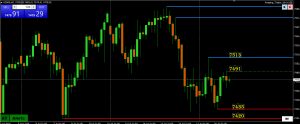
Trying to build momentum as well but upside limited unless 7500+ starts to trade again.
Thios leaves it consolidating and facing headwinds from firmer crude oil and higher boind yields.
Trying to rebuild momentum but to do so 29K (tested) would need to be regained so keep an eye on this level.
Headwinds today from firmer crude oil and higher US bond yields
EURUSD EURGBP GBPUSD
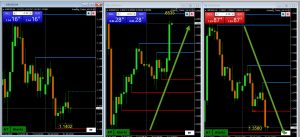
EURGBP: Up
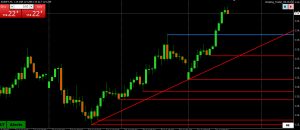
Markets always on the lookout for the path of least resistance. In this case it is selling JPY on its crosses where there ius less chance of sparking BoJ intervention.
In this case, there is a tug-of-war where AUDUSD is trading up while USDJPY is up as well. Note most of the move in the cross is the result of AUD moving up more while JPY is down less vs the USD.
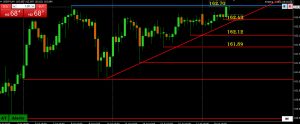
Red AT lines dominating, indicating up momentum and an upside risk.
So, what is holding USDJPY back?
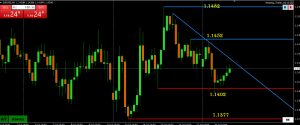
Currently trapped between 1.1400-50 (actual range 1.1402-52) with key levels outside of it at 1.1377-1.1482.
A case can be made for an upside risk looking at longer-term charts (but only if 1.1482 is firmly taken out) vs momentum tilted down (but contained while above 1.1400) on this chart.
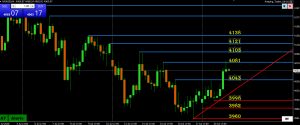
Momentum turning up
Faces layers of resistance following a break of a 4043 double top:
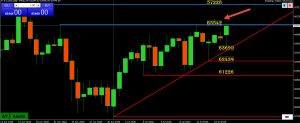
Testing 65542 (high so far 65584), if firmly taken out next target 67226.
If not, then support at 63690 and the trendline need to hold along with 62439 below it to keep risk on the upside.
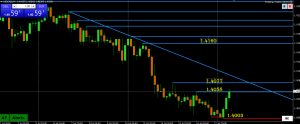
Pause above 1.40 suggests a defense of this level but to confirm a low is in, a solid move above 1.4058 followed by breaks of 1.4077 and the 4 hour trendline are needed.
On the other side, no more sell stops to run unless the low is taken out.
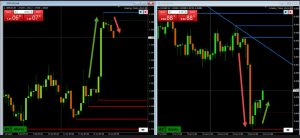
Understanding Cross-Currency Flows
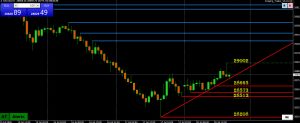
Similar picture with US500 except more volatility in the NAS100, which has been leading.
Here, too, trying to build up momentum (rising red AT lines) but only managing to test 29K, above which is needed to give it a bid
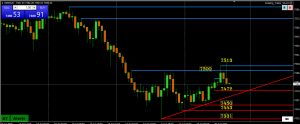
Trying to build upward momentum (rising red AT lines) but to give it a bid, 7500 (so far just pivoted) would need to become support..
(AT 1 hour chart)
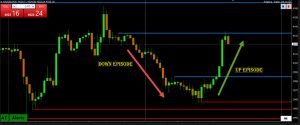
Trade the Episode, Not the Trend
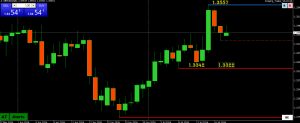
GBPUSD uptrend out of steam and consolidating within 1.34-1.35, a sort of a no man’s land for trading with key levels and stops outside of it (1.3322/42 and 1.3557).
To restore a bid aimed at the high, 1.35+ would be needed.
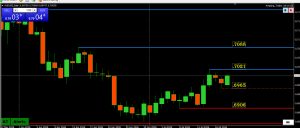
Trying to build fresh momentum with a move back to the pivotal .7000 level, which has trading again for the 4th day in a row (the longer this pattern goes on, the greater the risk of a directional move once it is broken).
This follows a retracement from .7021 => .6965 and bounce back to .7000.
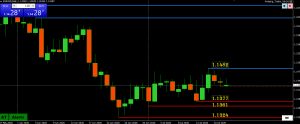
Struggling to regain momentum following the bounce off higher lows peaked at 1.1482.
The pause above 1.1400 following the high suggests current range is within 1.14-115. Assuming this is the case, the struggle to regain 1.1450 the past two days (high so far today 1.1449) has cooled the upside and sets the trading tone within the 1.14-1.15 range.
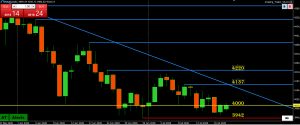
The 4000 level has trade in 5 of the past 6 days (only exception was one day above it), confirming this as the battle line that will ultimately dictate whether the low has been seen or not.
Otherwise, daily chart shows a 3-week consolidation between 3942and 4220 with the latter high set about 4 weeks ago,
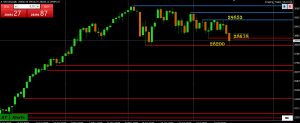
Break of the 28676 low has seen a pause just above 28200, the level (along with 28K) that bulls do not want to see trade.
(AT daily chart)
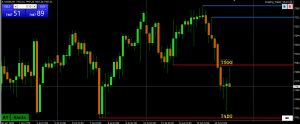
The level bulls do not want to see broken following the break of 7500 is 7420 so some hope with the low pausing above it at 7431.
However, as the chart shows, back above 7500 would be needed to negate the riisk
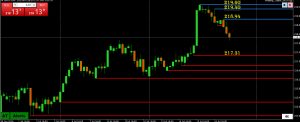
Coming off 18-year high where 3 blue AT lines indicate a bearish pattern that would need to break 217.31 to break momentum and confirm a high is in for now..
Note, with USDJPY trading a tight range, most of the moves in this cross are coming from moves in GBPUSD.
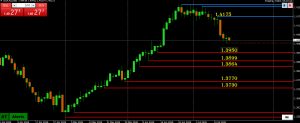
One week ago it was highlighted here a directional shift in risk to the downside after a 12-day pivot around 1.42 was broken.
In this regard, the 1.3950 target remains intact but 1.40, more psychological than technical) remains an obstacle to exposing it.
Retreat from just below a one year high (.8152 vs., .8169 ) would need to break .8009 (use .8000 as well ) to negate current momentum and shift it the other way.
Otherwise, move down will likely be treated as a retracement.
.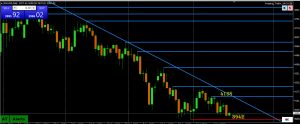
Daily chart: Downtrend but consolidating while above the 3942 low.
Other charts: So far unable to shake a focus from 4000 after a bunce from a pause above 3861 (low at 3969) , the last obstacle to 3942.