
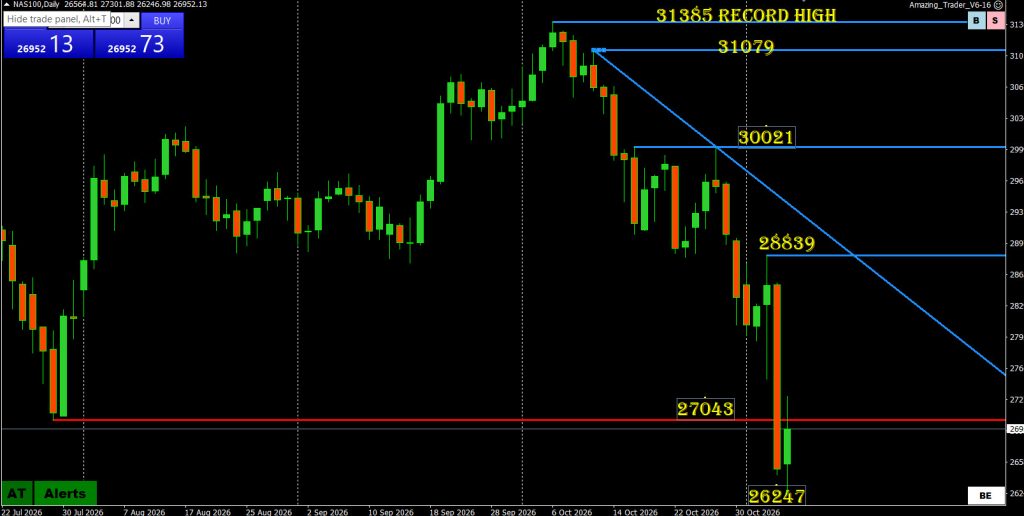
NAS100 is bouncing from 26247, but the daily chart still shows a pattern of lower highs and lower lows following the decline from the 31385 record high.
27043 is the immediate pivot. The latest candle traded above it but is back below it in this snapshot.
A sustained recovery above this level would help the bounce develop, although further gains would face the descending trendline and 28839 resistance.
Failure to reclaim 27043 leaves 26247 vulnerable to another test. A break below that low would expose the market to a fresh extension lower.
The question is whether buyers can build on this recovery or whether it becomes another failed bounce.l.
| Resistance | Support |
|---|---|
| 27043 | 26247 |
| 28839 | |
| 30021 | |
| 31079 | |
| 31385 — record high |
Bias: bearish below 27043. A recovery above it would improve the near-term outlook, but the broader downtrend remains intact.