
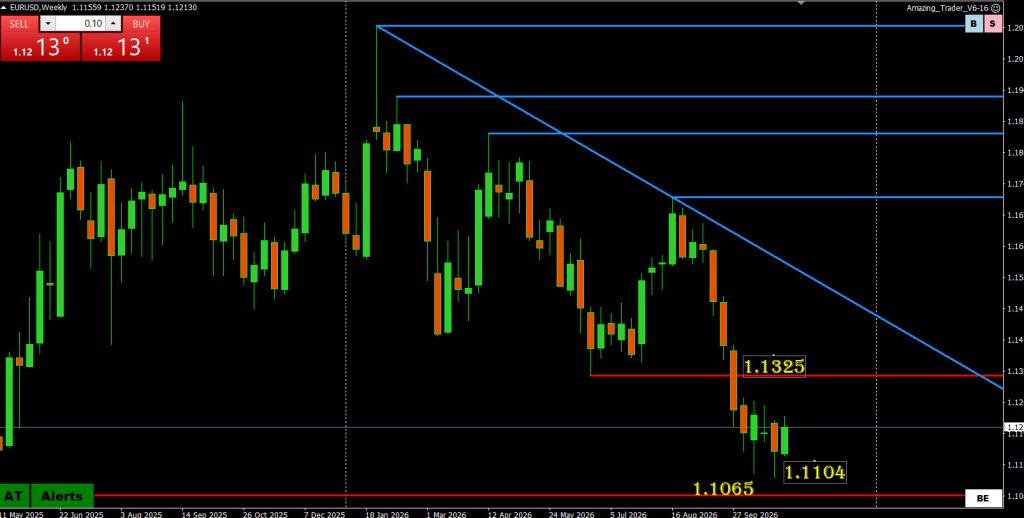
Weekly chart shows support above the key 1.1065 level has led to a pause but with the former support/breakdown level at 1.,1325 still some distance away, keep an eye on 1.12 as that will ultimately dictate whether the low is in and risk has shifted.
Shorter-term charts show a higher low (1.1136) with momentum trying to build to the upside where 1.1200 needs to hold to keep the current bid.’
Resistance: 1.1237 (intra-day high), 1.1255, 1.1270.