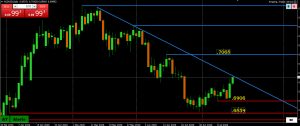
Testing daily trendline
Testing .7000, a pivotal level, which if broken opens the door to .7068, the AT target and level that needs to be broken to put the nail in the coffin of the downtrend.
Testing daily trendline
Testing .7000, a pivotal level, which if broken opens the door to .7068, the AT target and level that needs to be broken to put the nail in the coffin of the downtrend.
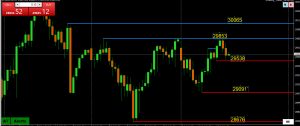
NAS100 tested stubborn 29853 resistance again, holding so far and remains the obstacle to 30K‘
Needs to hold 29538 holding (on this CFD chart) to keep risk pointed at the high.
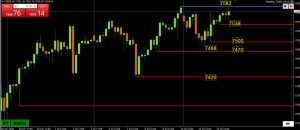
Post-PPI spike tested, held 7582 resistance.
Now dependent on 7539 holding (on this CFD chart) to keep momentum pointed up at the high.
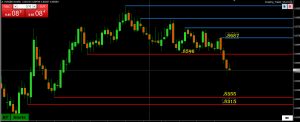
Major downtrend
4th weekly drop triggered by the break of .8596 has EURGBP aiming for pivotal .8500 (needs to hold to check the downside) with a void of support until .8355.
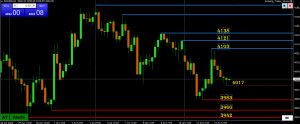
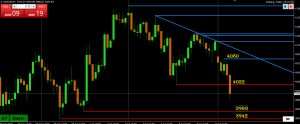
Expect choppy trade while within 4000-4100 with key levels outside of it at 3983-4103 as that is where stops likely lying.
Within 4000-4100, the 4050 level is likely to be pivotal in setting its trading tone (currently below it).
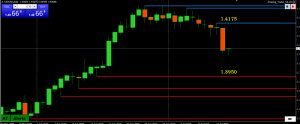
Performing like a textbook according to my logic:
Break of 12-day pivot (last Friday) sent a bearish directional signal
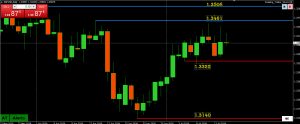
While technically in a daily uptrend, it would need to take out 1.3461 to confirm. High over this period has been 1.3452 with a lower high yesterday at 1.3442.
For the lower high to be anything but a pause, 1.3322 would need to be broken.

Nothing to get excited about.
EURUSD downtrend in a nearly 2-week consolidation between 1.1361-1.1462 (top end tested again yesterday) with the broader range at 1.1324-1.1473 (where there would be key stops), rewarding range traders at the expense of those hoping for breakouts.
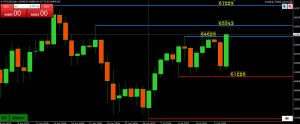
Trying to build up momentum where a break of 65543 is still needed to fully negate a downside risk and shift the risk to 67+
Otherwise, range is still 61-65K
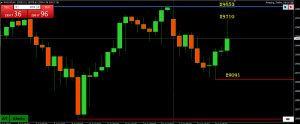
NAS100 getting a lift from cool US core CPI but still needs to take out a stubborn 29853 resistance to build momentum for a run back to 30K+.
Otherwise, more chop expected and dependent on 29K+ trading to keep a bid.
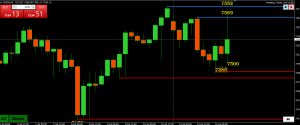
US500 spike higher following tame US core CPI would need to take out 7582 to build momentum on the upside.
Otherwise, dependent on 7500 holding as support to keep a bid.
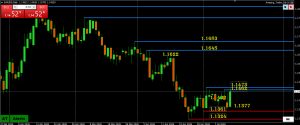
Post CPI pop would need to take out 1.1462 (tested) and 1.1473 (also 50% of 1.1622 => 1.1324) to put 1.;15 and 1.1508 (61.8%) on the map.
Otherwise, focus stays on 1.1450 to set its intra-day tone but with a limit on its downside while above 1.1430.
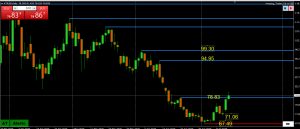
The move above 78.83 on this CFD chart) confirms the break of downward momentum and the low is in for now.
With next key levels far away, it likely leaves a focus on $80 to set its tone.
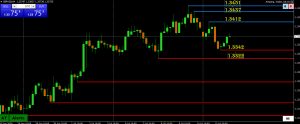
Pause above 1.3322 support so far checking downside but to negate current down momentum that started with last week’s 1.3451 high, 1.3412 (blue AT line) would need to be broken.
This leaves GBPUSD consolidating with a weaker EURGBP providing some support.
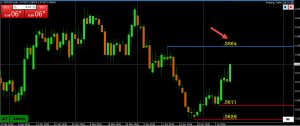
While up momentum is building on other time frame charts, the daily chart shows .5864 as the level that would need to be broken to break the back of the downtrend and confirm the low in in.
Otherwise, upside will be contained but still keep a bid as long as it trades above .5743 (4-hour support).
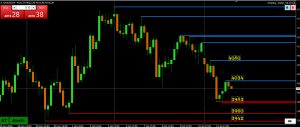
There are times when pivotal round number prove to be more important in setting trader sentiment than any specific chart point.
One of those pivotal levels is XAUUSD 4000, with a bounce Back above it following a pause above 4060 3960 and 3942 supports has cooled the downside risk but not negated it.
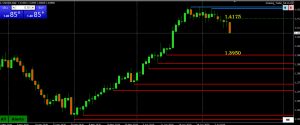
USDCAD building momentum to the downside following
While trade is below 1.4150, potential targets are 1.4000 and 1.3950.
USDCHF on the verge of testing its near one year high (.8170). If broken, next key level is .8476.
Key weekly (buy on dips support ) .7910
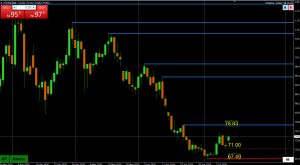
Higher low would need to be followed by a break of $78.83 (on this CFD chart) to indicate a low is in and break current momentum.
Line up your chart to see a similar \pattern as levels likely differ from this CFD chart

Turning bearish after Friday’s break of a 12-day pattern pivoting 1.42.
For momentum to build to the downside, 1.414, the 12-day range bottom needs to become resistance. Some caution as USDCAD has been unable to distance from it.
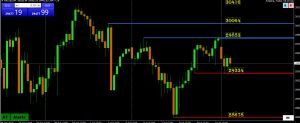
Consolidating below Friday’s 7583 high and dependent on 7500-05 holding as support to keep a bid and momentum pointed up.
Intra-day low so far 7520
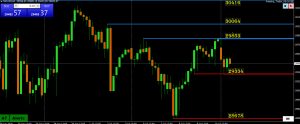
Consolidating after failing to break 29853 (on this CFD chart), needed for momentum to build further for a run back to 30K.
This leaves it dependent on 29334 holding to keep the downside in check and prevent a shift in risk back to 29K and 28678 low.
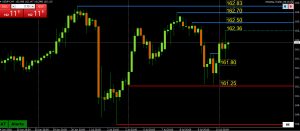
What stands out on this chart is a bounce from a double bottom just above 161.25 support.
On the other side, for momentum to buil;d to the upside, 161.80 needs tyo hold as support followed by a break of 162.25.
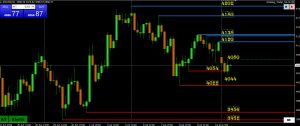
On the defensive while below 4100 but to build further momentum to the downside, 4022 would need to be firmly broken (low so far 4044).
On the other side, 4120-38 would need to be regained to restore a bid and shift the focus back to 4200.
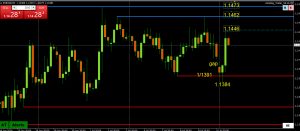
Bounce off the low more than filling the opening week gap but so far with limited follow through as it consolidates within its existing range (e.g. key supports 1.1361 and 1.1324)
Key resistance levels are clear on this chart, 1.1462 and 1.1473 (also a 50% retracement). To challenge these levels, 1.1450+ would be needed (note high today 1.,1446). Suggests upside is limited unless 1.1450+ trades.
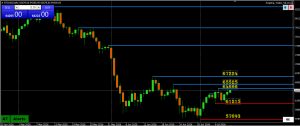
No change to this view: For momentum to build to the upside, 61215 needs to hold followed by a break above 65525.
Otherwise, it stays stuck in a range within -60/61-64/65.