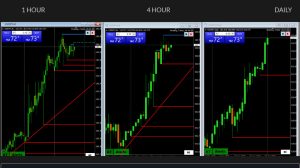
Break of a 5-day pattern around 7500 sends a bearish signal and now dependent on 7375 (Thursday low) holding TO AVOID PUTTING 73000 ON THE RADAR.
Moves to the upside should be limited unless 7500+ trades again
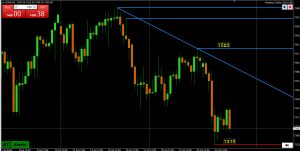
Break of a 5-day pattern around 7500 sends a bearish signal and now dependent on 7375 (Thursday low) holding TO AVOID PUTTING 73000 ON THE RADAR.
Moves to the upside should be limited unless 7500+ trades again
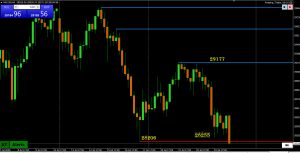
Break of 6 day pivot around 29K is a bearish sign if confirmed today.
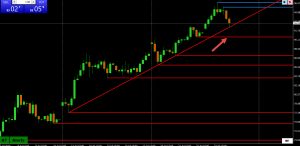
The focus of all global markets remains on the price of crude oil, specifically Brent oil (Sept) and the $100 level. The move below $100 (last 97.70) today has eased some of the pressure on global markets but so far just enough to steady the ship, not reverse it
The chart displayed here is a CFD chart with a different price feed but the AT lines on it should coincide with what you see on your charts.
Coming into the day, AUDUSD .7000 has printed 7 days in a row. To extend this pattern to 8 days, .7000 would need to trade again today. If not, break of the pattern would be typically bearish but in this case, only if the low is taken out.
Range over this period has been .6962-.7127, low set yesterday.
(AT daily chart)
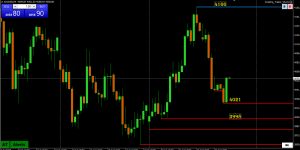
Pause yesterday above 4000 (low 4021) contained the downside but little to go for unless it trades outside of a 4000-4100 range.
From a broader perspective, for momentum to build, 3021 needs to hold followed by a brerak ofg 4166.
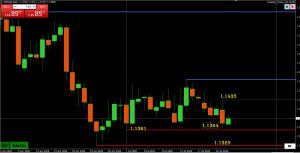
Pause yesterday above key 1.1361 support (low 1.1364) keeps the focus on 1.14, which would need to be regained to neutralize the downside risk (high so far today 1.1401)..
Keep one eye on the price of Brent oil, which has slipped back below $100 (the key focus), easing some of the pressure on global markets in general after spiking/closing above it yesterday.
Turning defensive after failing to test 67K but for down momentum to take control, 63685 eould need to be broken.
(AT 4 hour chart)
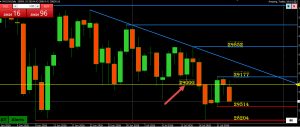
On the defensive as well while below 29K, not as pivotal as US500 7500 but a level that has traded 6 days in a row.
Should thgis pattern be broken tomoirrow, mit would send a bearish signal that would need to be confirmed by a firm break of 28000-28200.
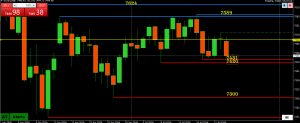
On the defensive while below 7500, a level pivoted in each of the past 5 days.
Should this pattern be broken tomorrow, it would send a bearish signal that would need to see 7420 broken to confirm…
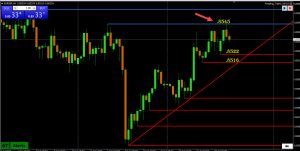
If trading GBPUSD and/or EURUSD, especially the former as market has more trouble absorbing that side of the cross, don’t ignore EURGBP.
I suggest reading our blog article, Understanding Cross-Currency Flows, and then look at this EURGBP chart.
Note how selling pressure eased on GBPUSD and EURUSD lost its bid after EURGBP held a test of key .8545 resistance.
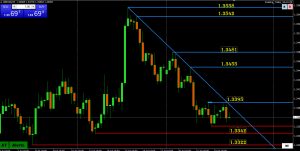
Momentum turning down following the 1.3558 high but for damage to be fatal, 1.3342 and 1.3322 would need to be broken.’
To break momentum, the trendline and 1.3395 would need to be broken.
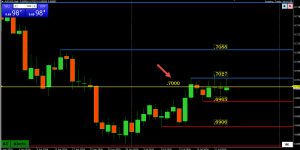
Extending its pivot around .7000 to 7 days in a row. Range during this period has been .6965-.7027
As I showed in USDCAD when a break of a 12-day pivot around a pivotal round number (1.42) seny a (bearish) directional signal, keep an eye on the pattern around AUD.7000.
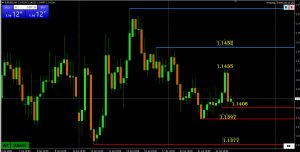
EURUSD currently trapped in a 1.1400-50 range with key levels just outside of it (1.1397-1.1452) but for how long?
Note, stops run overnight to 1.1435 and quick retreat suggests EURUSD unable to shake a focus from 1.14.
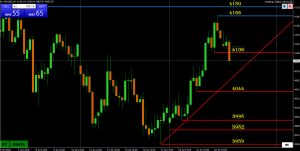
Pause below 4180 and mover back below 4106 breaks momentum but to confirm a high is in and shift the focus back to 4000, the trendline and 4044 support would need to be broken.
(AT 4 hour chart)
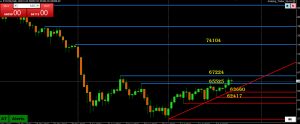
Keeps a bid while above 65525 (and 65K) but upside would need to break 67224 (and 68K+ for confirmation) to build further momentum.
If 67224 stays intact, then 63660 and 62417 (and the trendline) need to hold to keep the downside contained.
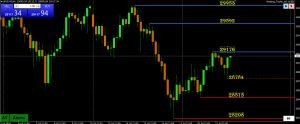
Battle continues here as well over 29K with its pivot extended to extended to 5 days in a row.
For bulls to take control, 29K needs to become support followed by a firm break above 29172 (use 29200 as well).
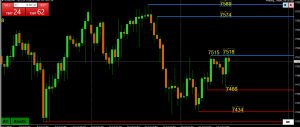
Battle over 7500 continues with a pivot around this level extended to 4 days in a row.
For bulls to take control, 7500 needs to become support followed by a firm break above 7515.
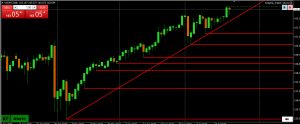
USDCAD torn between Trump tariff threats (bullish) + pause above 1.40 vs. firmer oil prices (bearish)
Treating the bounce from above 1.40 as a retracement shows the following FIBOS using 1.4247 =< 1.4003 (high 1.4111)
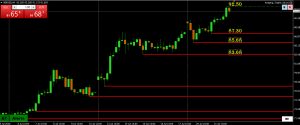
Chart is clear;
Momentum up
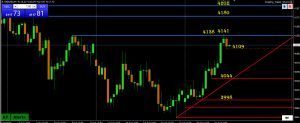
Momentum up, 4138 target hit (high 5151)
If 4138 is firmly broken, then target shifts to 41.80-4202
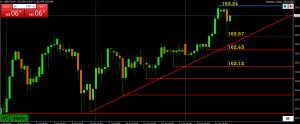
Under normal conditions, USDJPY would be looking to accelerate the upside.
However, threat of BoJ intervention makes this a not normal market and at a minimum, slkows e pace..
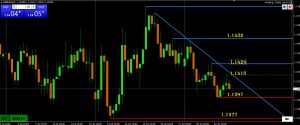
Momentum pointed down but without much enthusiasm unless 1.1400 and 1.1377 are firmly broken (low 1.1397).
On the upside, 1.1429 break would be needed to negate current risk.
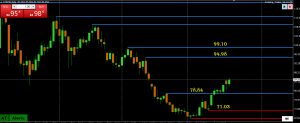
With down momentum broken following the move above 78.84 (on this CFD chart), battle is on for 85.00, above which is needed to give it psychological boost as there is a void of key resistance above it (high 85.66).
Key an eye on correlations as so far only the USD has reacted with US stocks, GOLD, and BITCOIN so far ignoring.
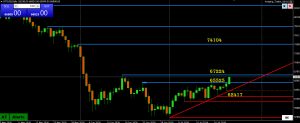
Break and close above 65525 would be considered a breakout that would need to get through 67224 (leave a cushion to above 68K to confirm) to open a void on the upside.
On the downside, back below 65525 *(leave a cushion back below 65K ro confirm) to cool the risk.
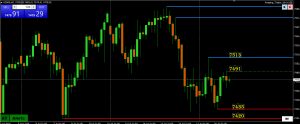
Trying to build momentum as well but upside limited unless 7500+ starts to trade again.
Thios leaves it consolidating and facing headwinds from firmer crude oil and higher boind yields.
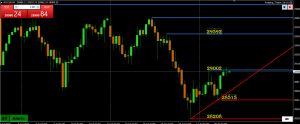
Trying to rebuild momentum but to do so 29K (tested) would need to be regained so keep an eye on this level.
Headwinds today from firmer crude oil and higher US bond yields
EURUSD EURGBP GBPUSD
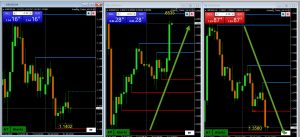
EURGBP: Up
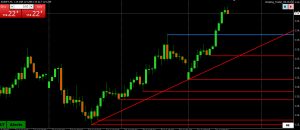
Markets always on the lookout for the path of least resistance. In this case it is selling JPY on its crosses where there ius less chance of sparking BoJ intervention.
In this case, there is a tug-of-war where AUDUSD is trading up while USDJPY is up as well. Note most of the move in the cross is the result of AUD moving up more while JPY is down less vs the USD.
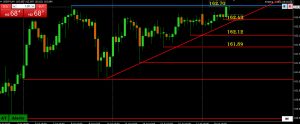
Red AT lines dominating, indicating up momentum and an upside risk.
So, what is holding USDJPY back?