Page 2

Daily Tips

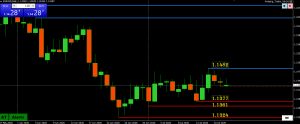
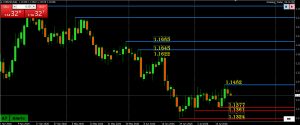
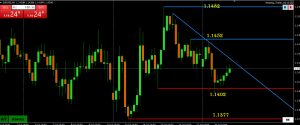
Currently trapped between 1.1400-50 (actual range 1.1402-52) with key levels outside of it at 1.1377-1.1482.

A case can be made for an upside risk looking at longer-term charts (but only if 1.1482 is firmly taken out) vs momentum tilted down (but contained while above 1.1400) on this chart.
Read more »

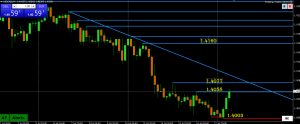
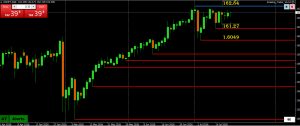
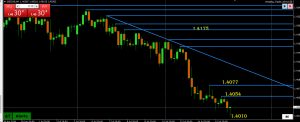
Pause above 1.40 suggests a defense of this level but to confirm a low is in, a solid move above 1.4058 followed by breaks of 1.4077 and the 4 hour trendline are needed.

On the other side, no more sell stops to run unless the low is taken out.

Read more »

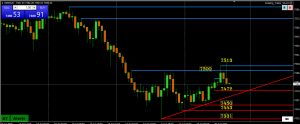
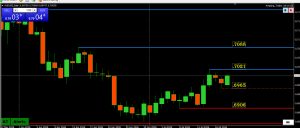
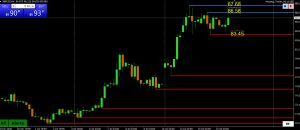
Trying to build fresh momentum with a move back to the pivotal .7000 level, which has trading again for the 4th day in a row (the longer this pattern goes on, the greater the risk of a directional move once it is broken).

This follows a retracement from .7021 => .6965 and bounce back to .7000.

Read more »

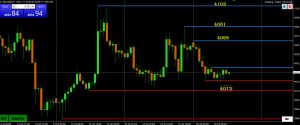
Struggling to regain momentum following the bounce off higher lows peaked at 1.1482.

The pause above 1.1400 following the high suggests current range is within 1.14-115. Assuming this is the case, the struggle to regain 1.1450 the past two days (high so far today 1.1449) has cooled the upside and sets the trading tone within the 1.14-1.15 range.

Read more »

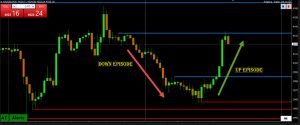
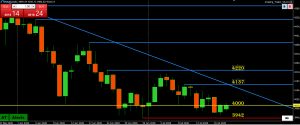
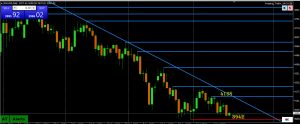
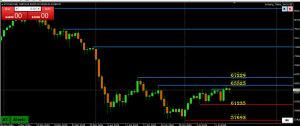
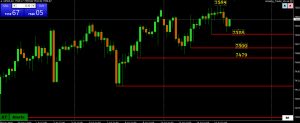
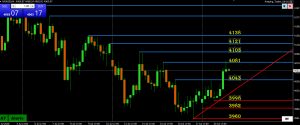
The 4000 level has trade in 5 of the past 6 days (only exception was one day above it), confirming this as the battle line that will ultimately dictate whether the low has been seen or not.

Otherwise, daily chart shows a 3-week consolidation between 3942and 4220 with the latter high set about 4 weeks ago,

Read more »

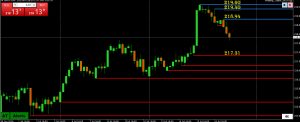
Coming off 18-year high where 3 blue AT lines indicate  a bearish pattern that would need to break 217.31 to break momentum and confirm a high is in for now..

Note, with USDJPY trading a tight range, most of the moves in this cross are coming from moves in GBPUSD.

Read more »

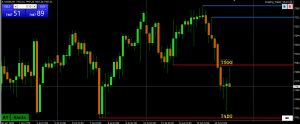
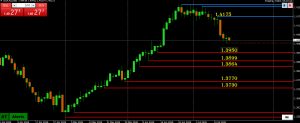
One week ago it was highlighted here a directional shift in risk to the downside after a 12-day pivot around 1.42 was broken.

In this regard, the 1.3950 target remains intact but 1.40, more psychological than technical) remains an obstacle to exposing it.

Read more »

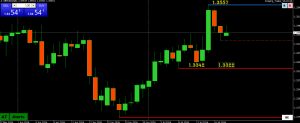
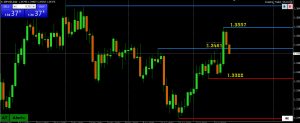
Failure to hold 1.35+ has seen a move below the 1.3461 breakout level

Catalyst: EURGBP bounce back above .8500 has been a weight on GBPUSD while EURUSD lags and trades a tight range. See upcoming article on using crosses to trade spot currencies.

Read more »

If you followed our USDCAD posts you will learn a good lesson on how directional signals can come from a break of a pattern trading around a key round number.

In this case it was a break of a 12-day pivoit around 1.,42.

Read more »

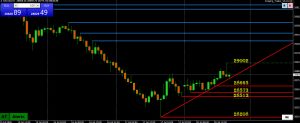
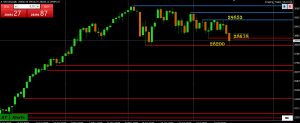
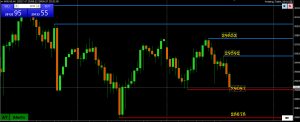
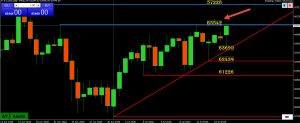
Momentum trying to build to the downside (2 blue AT lines followed by a break of 29091, brief so far) and dependent on 29K (more psychological than technical) holding to [prevent exposing the key 28678 low.

Back above 29091, would cool but then 29592 needed to negate the risk

Read more »

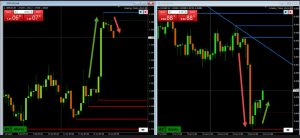
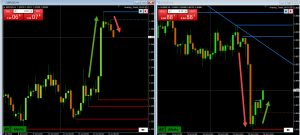
It is said that one picture says a  thousand words. In this case it is these two charts indicating the impact of EURGBP on GBPUSD over the past two days (i.e. market having more trouble absorbing the GBPUSD side of the cross flow).

Note how GBPUSD (lower high) and EURGBP (higher low) are mirroring each other.

Read more »

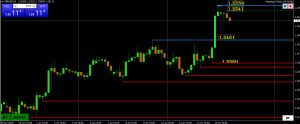
A lower GBPUSD high (2 blue AT lines) indicates time for a pause where 1.35 needs to hold to keep a strong bid with fallback support as long as it trades above yesterday’s 1.3461 breakout level.

Keep an eye on EURGBP, which has bounced today, and taken some pressure off the GBPUSD upside, suggesting whatever sell order was behind the GBPUSD surge yesterday has been filled.

Read more »