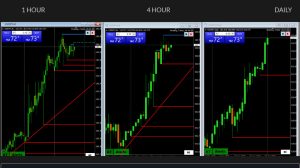

Momentum up, 4138 target hit (high 5151)
If 4138 is firmly broken, then target shifts to 41.80-4202
Momentum up, 4138 target hit (high 5151)
If 4138 is firmly broken, then target shifts to 41.80-4202

Under normal conditions, USDJPY would be looking to accelerate the upside.
However, threat of BoJ intervention makes this a not normal market and at a minimum, slkows e pace..

Momentum pointed down but without much enthusiasm unless 1.1400 and 1.1377 are firmly broken (low 1.1397).
On the upside, 1.1429 break would be needed to negate current risk.
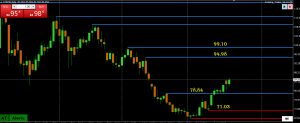
With down momentum broken following the move above 78.84 (on this CFD chart), battle is on for 85.00, above which is needed to give it psychological boost as there is a void of key resistance above it (high 85.66).
Key an eye on correlations as so far only the USD has reacted with US stocks, GOLD, and BITCOIN so far ignoring.

Break and close above 65525 would be considered a breakout that would need to get through 67224 (leave a cushion to above 68K to confirm) to open a void on the upside.
On the downside, back below 65525 *(leave a cushion back below 65K ro confirm) to cool the risk.
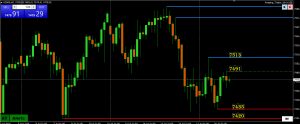
Trying to build momentum as well but upside limited unless 7500+ starts to trade again.
Thios leaves it consolidating and facing headwinds from firmer crude oil and higher boind yields.

Trying to rebuild momentum but to do so 29K (tested) would need to be regained so keep an eye on this level.
Headwinds today from firmer crude oil and higher US bond yields
EURUSD EURGBP GBPUSD
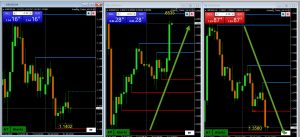
EURGBP: Up

Markets always on the lookout for the path of least resistance. In this case it is selling JPY on its crosses where there ius less chance of sparking BoJ intervention.
In this case, there is a tug-of-war where AUDUSD is trading up while USDJPY is up as well. Note most of the move in the cross is the result of AUD moving up more while JPY is down less vs the USD.