
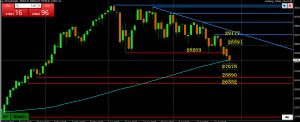
Pattern: 5 down days )red candles) in a row. Pattern would need to be broken before considering the low is in.
Watch the 100 day mva (blue line, 27787), testing below it.
In any case, 28K+ is needed to slow the risk.
(AT daily chart)
Pattern: 5 down days )red candles) in a row. Pattern would need to be broken before considering the low is in.
Watch the 100 day mva (blue line, 27787), testing below it.
In any case, 28K+ is needed to slow the risk.
(AT daily chart)