

Red AT lines dominating, indicating up momentum and an upside risk.
So, what is holding USDJPY back?
Red AT lines dominating, indicating up momentum and an upside risk.
So, what is holding USDJPY back?

Currently trapped between 1.1400-50 (actual range 1.1402-52) with key levels outside of it at 1.1377-1.1482.
A case can be made for an upside risk looking at longer-term charts (but only if 1.1482 is firmly taken out) vs momentum tilted down (but contained while above 1.1400) on this chart.

Momentum turning up
Faces layers of resistance following a break of a 4043 double top:

Testing 65542 (high so far 65584), if firmly taken out next target 67226.
If not, then support at 63690 and the trendline need to hold along with 62439 below it to keep risk on the upside.

Pause above 1.40 suggests a defense of this level but to confirm a low is in, a solid move above 1.4058 followed by breaks of 1.4077 and the 4 hour trendline are needed.
On the other side, no more sell stops to run unless the low is taken out.

Understanding Cross-Currency Flows
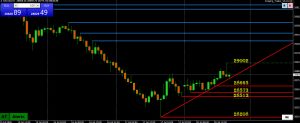
Similar picture with US500 except more volatility in the NAS100, which has been leading.
Here, too, trying to build up momentum (rising red AT lines) but only managing to test 29K, above which is needed to give it a bid

Trying to build upward momentum (rising red AT lines) but to give it a bid, 7500 (so far just pivoted) would need to become support..
(AT 1 hour chart)
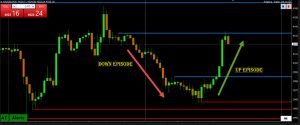
Trade the Episode, Not the Trend

GBPUSD uptrend out of steam and consolidating within 1.34-1.35, a sort of a no man’s land for trading with key levels and stops outside of it (1.3322/42 and 1.3557).
To restore a bid aimed at the high, 1.35+ would be needed.