
Why Markets Move
Market Force
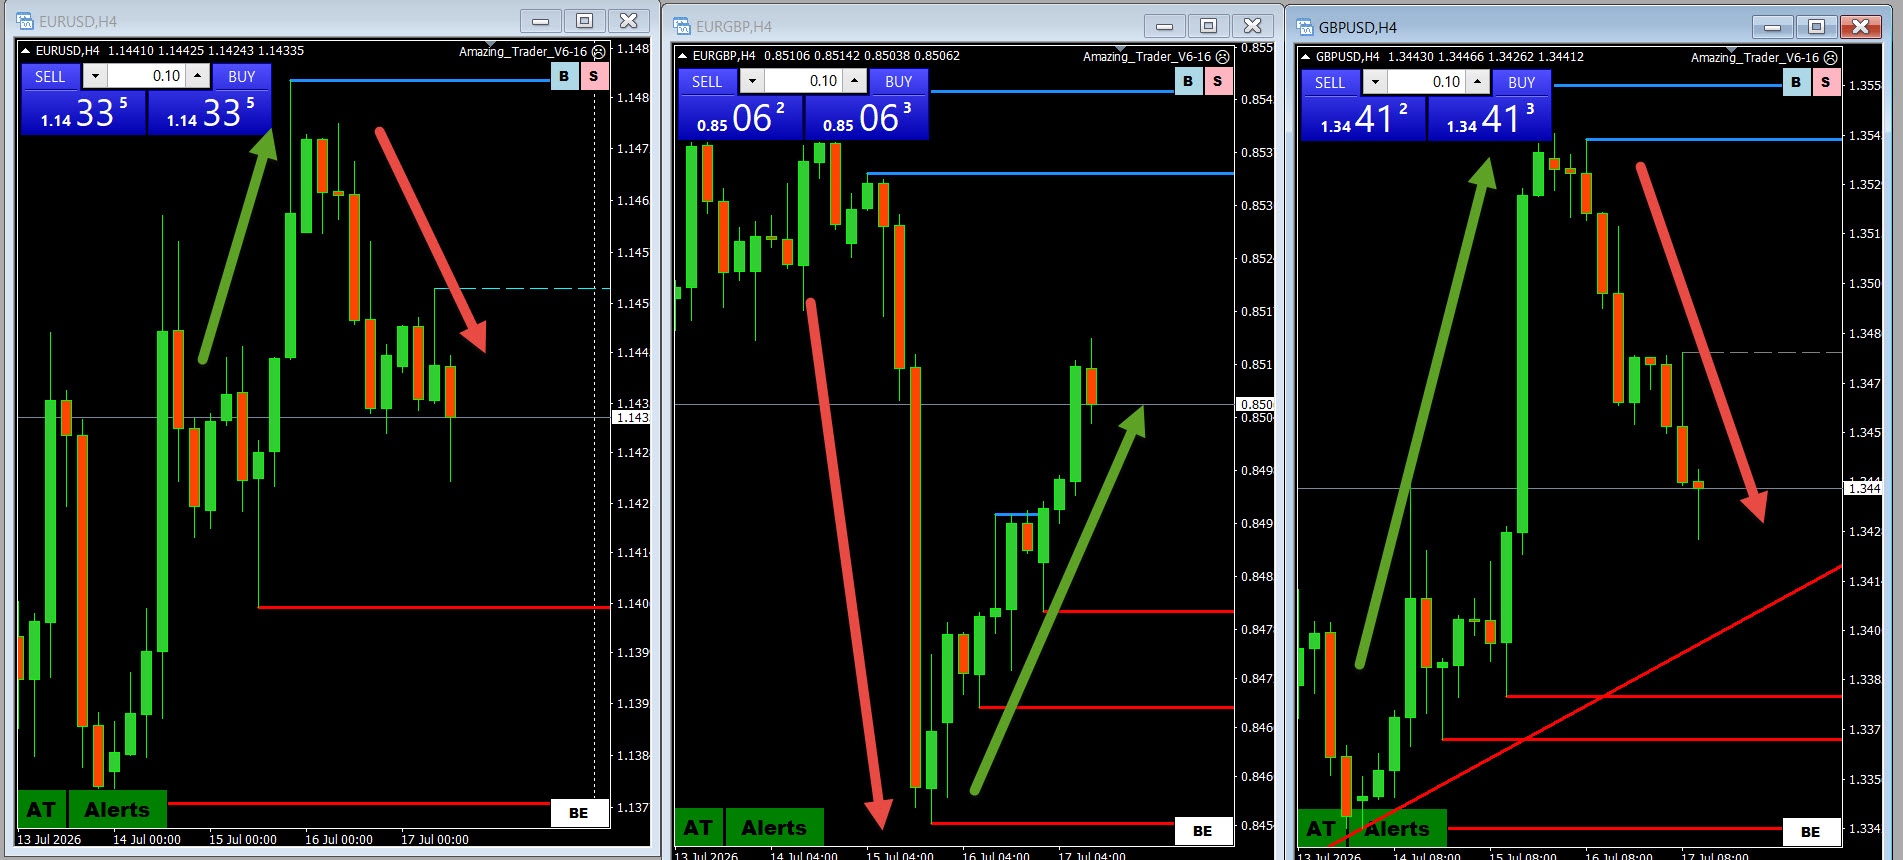
Every financial market, whether forex, stocks, commodities, or cryptocurrencies, is ultimately driven by one force: the interaction between buyers and sellers. While traders often focus on economic reports, chart patterns, indicators, and news headlines, these factors matter only because they influence supply and demand.
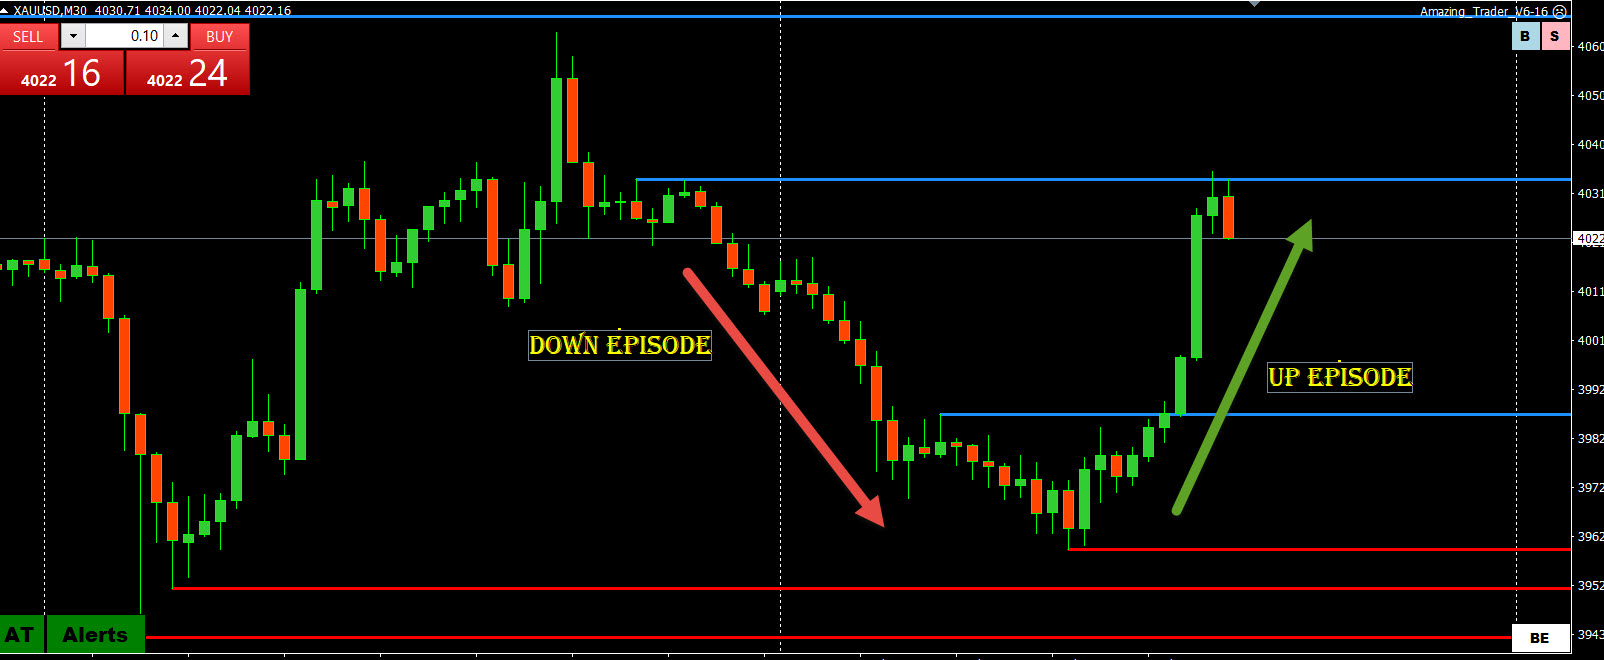
At its foundation, every price movement reflects an imbalance between those willing to buy and those willing to sell. When buyers become more aggressive than sellers, prices rise. When sellers dominate, prices fall. Markets constantly adjust in an effort to find a price where supply and demand are once again in balance.
The Market’s Constant Search for Equilibrium
Financial markets never stand still. Prices move because the balance between supply and demand is continually changing. New information, shifting sentiment, economic developments, and institutional order flow all influence how participants value an asset.
When demand exceeds available supply, prices must rise to attract additional sellers. Conversely, when supply overwhelms demand, prices decline until buyers find value and step in.
This process creates the trends, corrections, breakouts, and reversals traders see every day. Understanding this concept provides a deeper perspective on market behavior and helps explain why prices often move sharply even when no obvious news catalyst exists.
Technical Analysis Reflects Market Forces
A common misconception among traders is that technical analysis causes markets to move. In reality, technical analysis serves as a visual representation of the underlying battle between buyers and sellers.
However, technical levels can influence market behavior because so many traders watch them. Support and resistance levels, trendlines, moving averages, and chart patterns often attract significant order flow.
For example, when a major support level breaks, stop-loss orders may be triggered while momentum traders enter new short positions. This creates additional selling pressure, increasing the supply-demand imbalance and accelerating the move lower.
Likewise, when resistance is breached, buy stops and fresh buying can fuel a rapid rally as demand overwhelms available supply.
The effect becomes even more significant on higher time frames. Daily, weekly, and monthly levels are monitored by institutions, hedge funds, and algorithmic trading systems. As a result, reactions around these levels often have a larger and more lasting impact on market direction.
How Traders Can Benefit from Supply and Demand Analysis
Recognizing that supply and demand drive price action allows traders to interpret market behavior more effectively. Instead of viewing charts as a collection of indicators, traders can focus on identifying areas where buyers or sellers are likely to become active.
Identify Key Price Zones on a Chart
One of the most valuable skills a trader can develop is identifying areas where price previously reversed, stalled, or accelerated sharply.
These locations often reveal where a significant imbalance existed in the past. Such zones can become important support or resistance levels as traders remember previous market reactions and position themselves accordingly.
Monitor Market Reactions to Key Levels
The response to a key level can reveal valuable information about market sentiment.
If support holds and buyers quickly step in, demand may still be strong enough to sustain the trend. If support fails, it may signal that sellers have gained control and that further downside is likely.
The same principle applies to resistance levels. A successful breakout often indicates growing demand, while repeated failures may suggest that sellers remain in control.
Failure to follow through on breakout attempts can give a valuable clue as well.
Double tops, double bottoms, and triple tests of a level deserve special attention. While these patterns can highlight significant support or resistance, repeated testing often weakens a level as available orders are gradually absorbed.
Anticipate Potential Market Behavior
By understanding where supply and demand may emerge, traders can better anticipate future price movement.
Markets frequently accelerate after important levels break because new participants enter while existing traders are forced to exit losing positions. This combination can create powerful momentum moves.
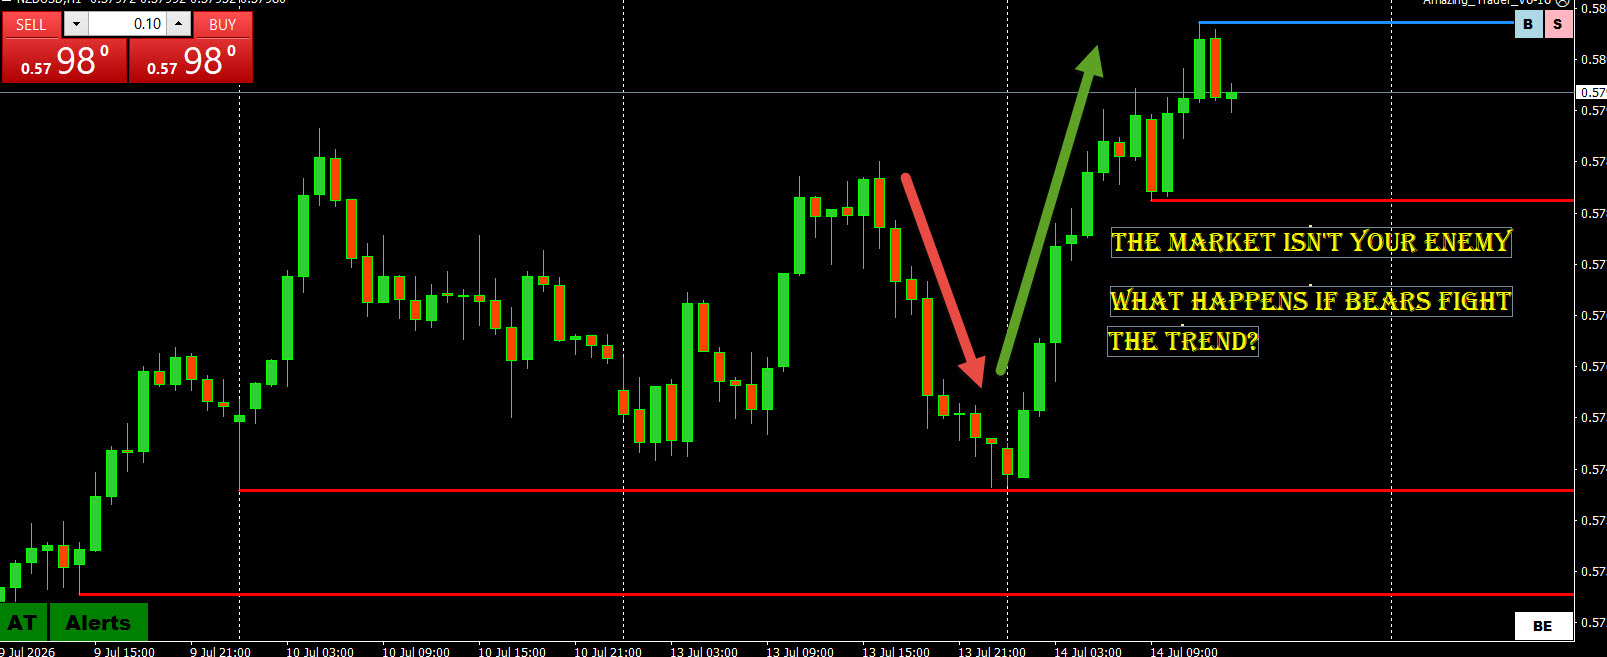
Attempting to trade against a strong imbalance can be risky. When institutional money is driving a trend, traders who oppose it often become liquidity suppliers for larger market participants. Waiting for equilibrium to return before evaluating new opportunities can improve both timing and risk management.
Understanding Retracements and Trend Continuation
Not every move against a trend signals a reversal. Many countertrend moves are simply retracements that temporarily relieve an overextended market before the primary trend resumes.
Successful traders learn to distinguish between corrective pullbacks and genuine trend changes.
This requires identifying critical levels that can either confirm the existing trend or signal a shift in market structure. For example, a break below major support during an uptrend may indicate that sellers are gaining control and that a larger reversal is underway. On the other hand, a successful defense of that support level may strengthen the bullish outlook.
Recognizing these differences helps traders avoid entering positions prematurely and improves overall trade selection.
Market Force
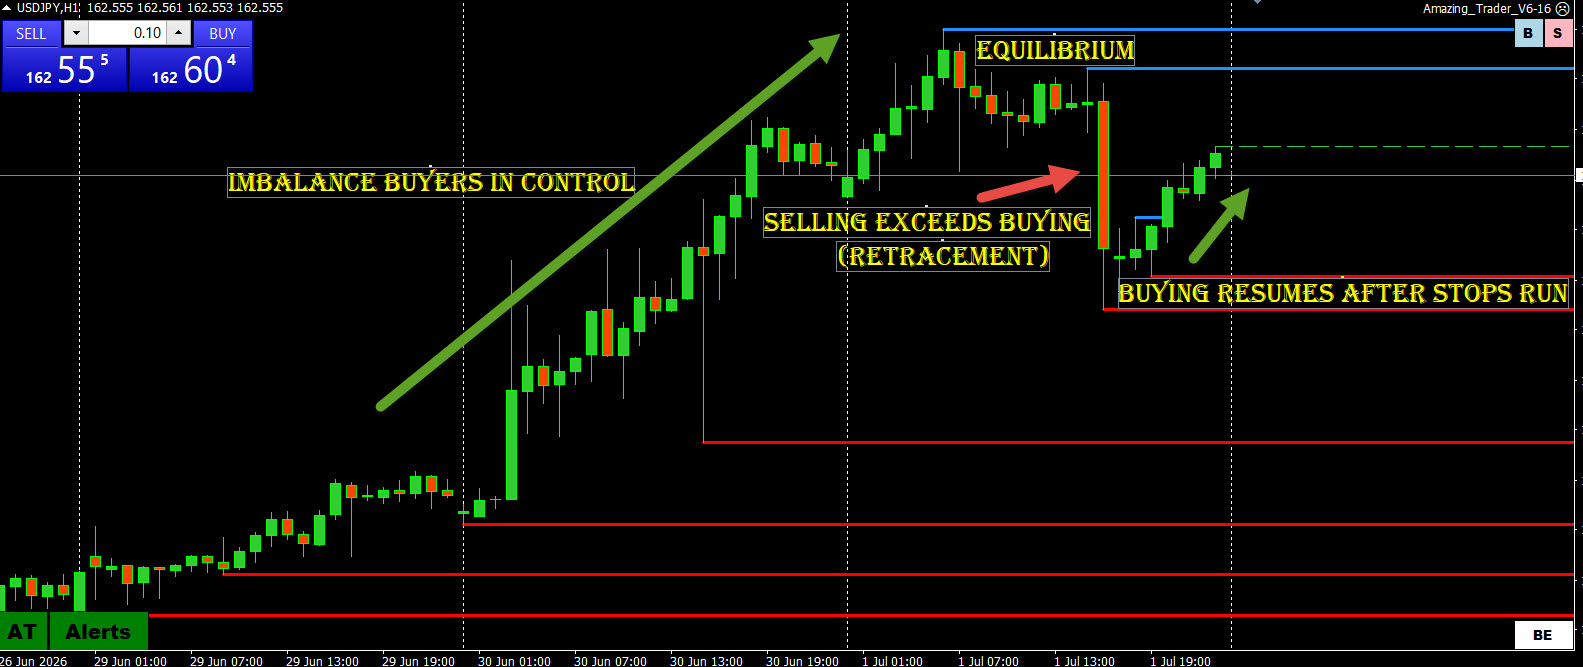
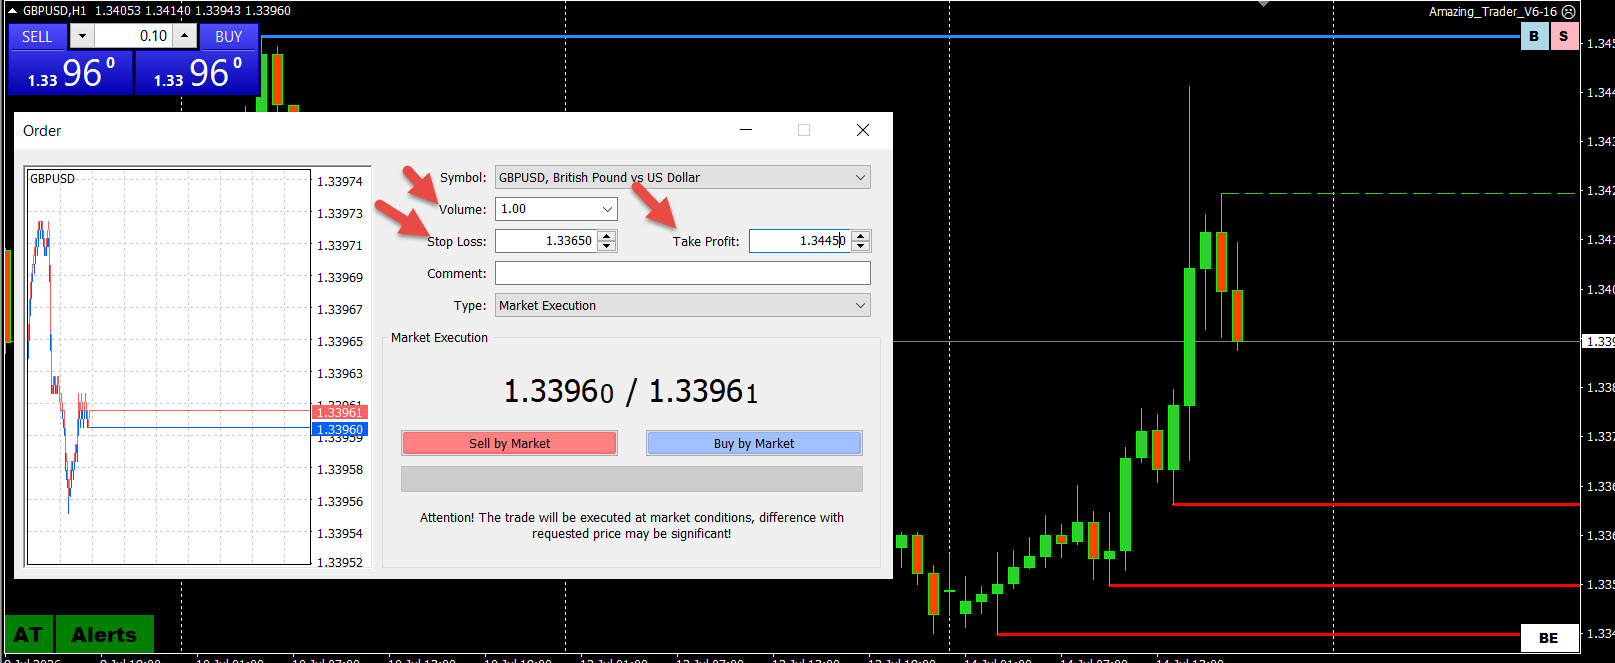
USDUSD 1 HOUR CHART:
Buying imbalance => Equilibrium (consolidation) => Selling imbalancxe (retracement) => Buying imbalance )but smaller)>
Market Force
Why Supply and Demand Should Be Part of Every Trading Strategy
Regardless of whether your approach is technical, fundamental, or algo driven, supply and demand provide the context behind every market move.
To sum up, markets move because supply and demand fall out of balance. Every rally, decline, breakout, and reversal can ultimately be traced back to the relationship between buyers and sellers. What follows is a market’s never ending attempt to restore equilibrium between buyers and sellers.
Technical indicators, chart patterns, and market analysis tools can help identify opportunities, but they are most effective when viewed through the lens of supply and demand.
Traders who understand this principle can better identify meaningful price levels, anticipate market reactions, and make decisions based on the forces that truly drive price movement. By focusing on where imbalances exist and how they may evolve, traders can gain a clearer understanding of market behavior and improve their ability to navigate changing market conditions
Market Force
Trading Blog
Forex Forum
Test Plugin
About author

Add comment