
How Multiple Time Frame Analysis Can Improve Your Trading Decisions
Time Frame Analysis
One of the biggest mistakes traders make is focusing on a single chart while ignoring the bigger market picture. Whether you’re trading a 5-minute, 15-minute, 1-hour, or 4-hour chart, relying on just one time frame can lead to poor trade selection and unnecessary losses.
Professional traders rarely make decisions based on a single chart. Instead, they use multiple time frame analysis, often referred to as drilling down, to identify the strongest side of the market before looking for an entry.
By understanding what longer-term traders are doing, you can dramatically increase the probability of trading with market momentum rather than against it.
What Is Drill Down Trading?
Drilling down is the process of analyzing charts from higher time frames down to lower time frames.
Rather than beginning with a short-term chart, traders first examine the larger trend and then progressively move to shorter time frames to refine their trade entry.
The objective isn’t simply to identify whether the market is bullish or bearish. It’s to determine which side of the market currently has the greatest probability of continuing and where institutional traders are most likely positioning themselves.
This approach helps traders avoid taking low-probability trades that go against the prevailing market flow.
Why Multiple Time Frame Analysis Matters
Markets move in waves.
A decline on a 15-minute chart may look like the beginning of a major downtrend, but when viewed on a daily chart it may simply be a normal pullback within a much larger uptrend.
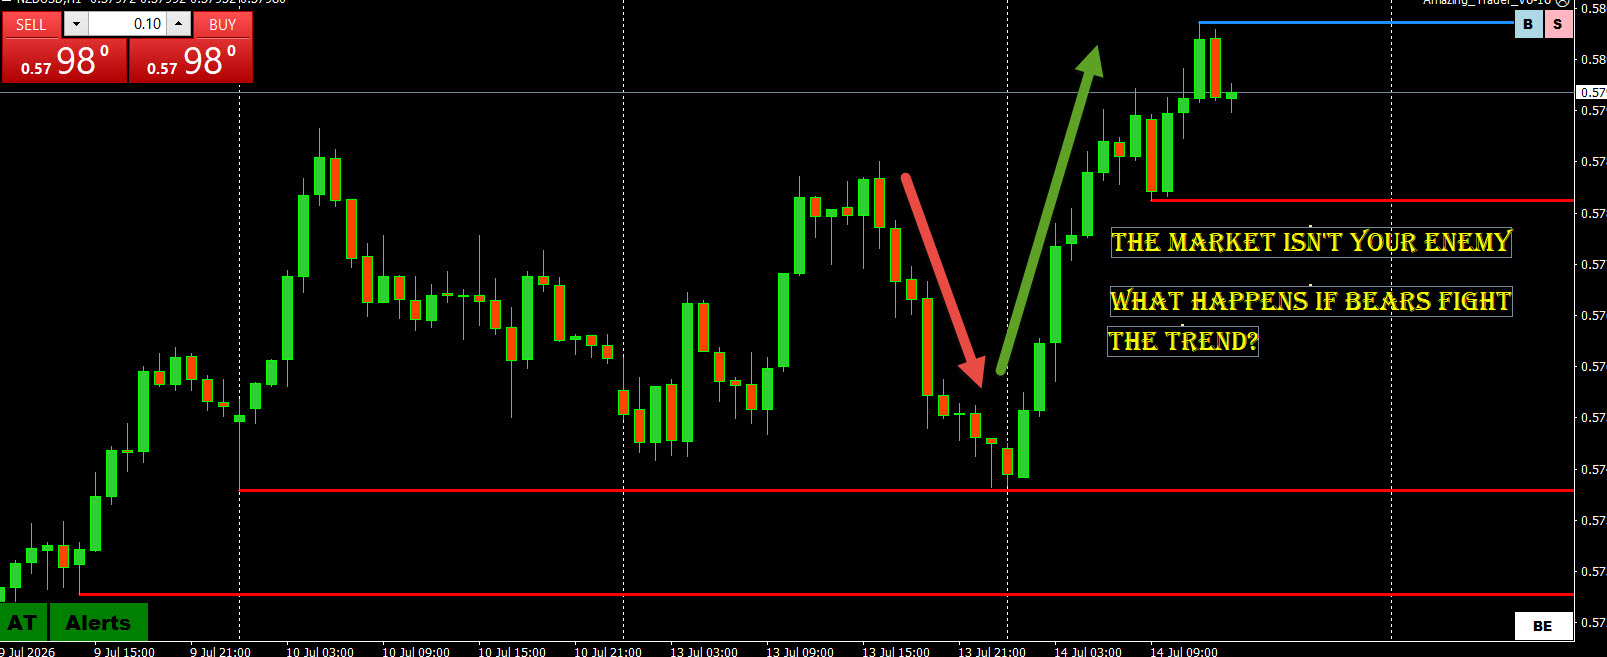
Likewise, a sharp rally on a 5-minute chart can easily fool traders into buying just as the longer-term downtrend resumes.
Without the context of higher time frames, it’s easy to misinterpret price action.
Looking at multiple charts allows traders to separate temporary corrections from genuine trend changes.
A Simple Drill Down Process
A common sequence for multiple time frame analysis is:
- Weekly Chart
- Daily Chart
- 4-Hour Chart
- 1-Hour Chart
- 30-Minute Chart
- 15-Minute Chart
- 5-Minute Chart
Each chart provides a different piece of the puzzle.
The higher time frames establish the dominant market direction, while the lower time frames help pinpoint precise entry opportunities with better risk-to-reward ratios.
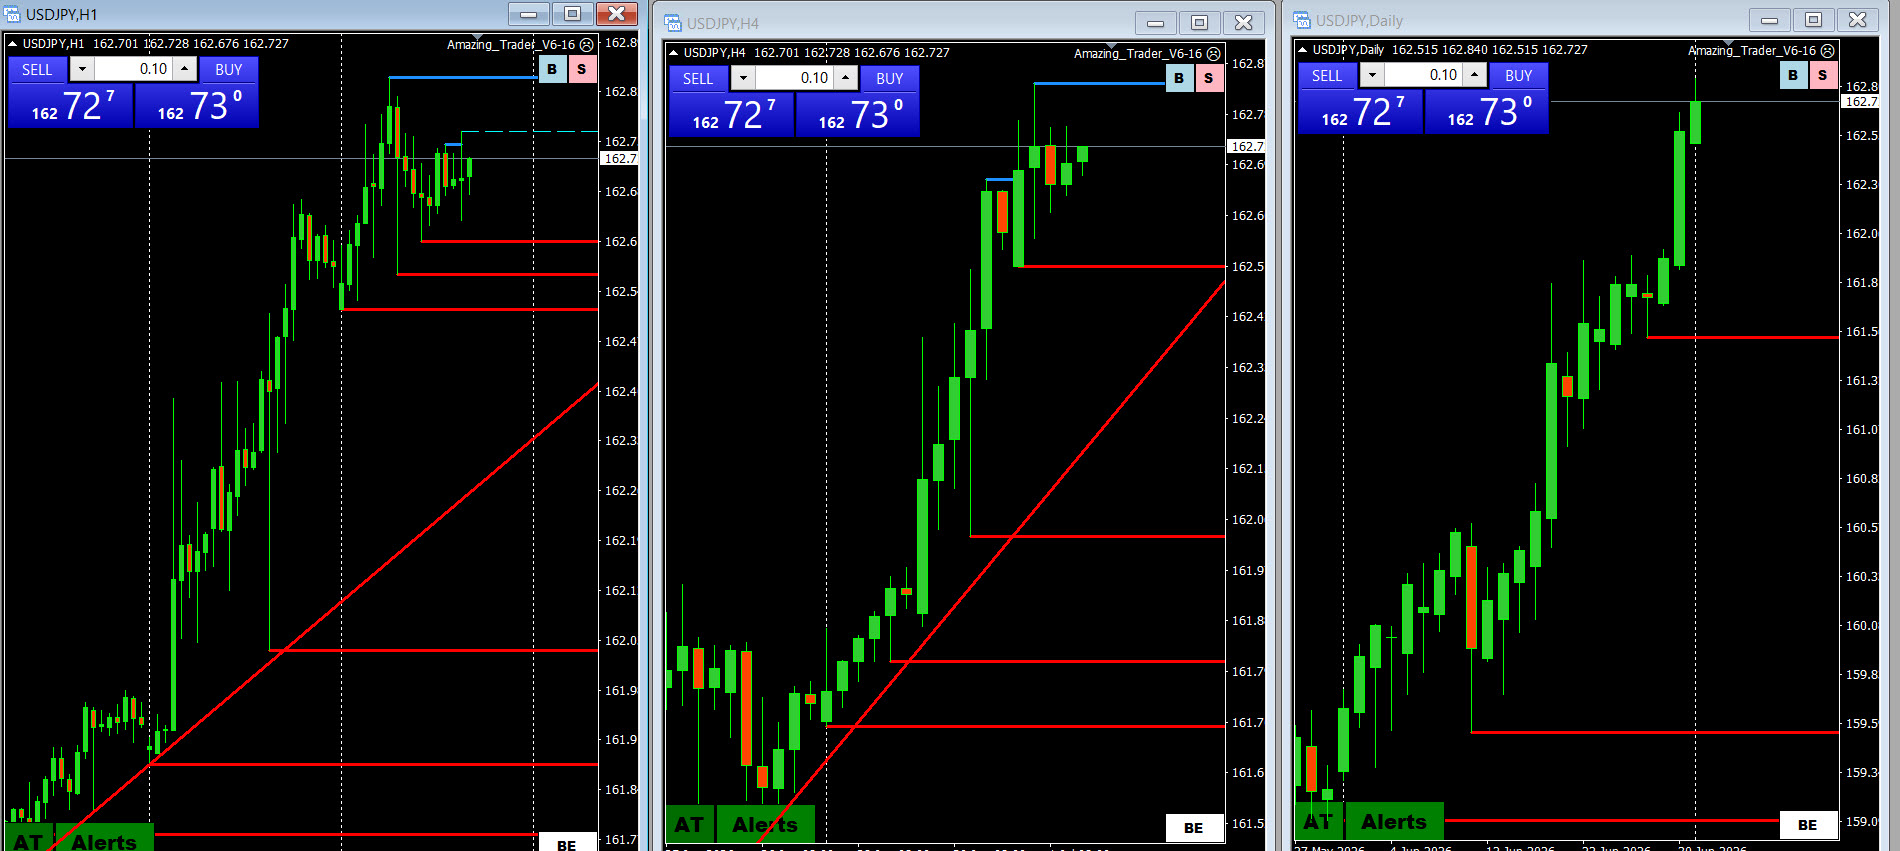
USDJPY multiple time frames show up momentum in the same direction
1 HOUR 4 HOUR DAILY
Look for Alignment Between Time Frames
The strongest trading opportunities often occur when several time frames are moving in the same direction.
For example, imagine:
- The daily chart is in an established uptrend.
- The 4-hour chart continues making higher highs and higher lows.
- The 1-hour chart shows renewed buying after a brief pullback.
This type of alignment suggests that buyers remain in control across multiple time horizons.
The greater the agreement between charts, the stronger the underlying momentum tends to be.
While no setup guarantees success, trading in the direction supported by several time frames generally offers a higher probability than trading against them.
Think Like Institutional Traders
Large banks, hedge funds, and institutional investors typically operate using longer-term charts than most retail traders.
These market participants rarely chase price after an extended move.
Instead, they often:
- Buy pullbacks during established uptrends.
- Sell rallies during established downtrends.
- Add to positions when price retraces into key support or resistance levels.
Understanding this behavior provides valuable insight into where significant buying or selling interest may emerge.
Rather than reacting emotionally to every short-term price swing, traders can anticipate where institutional money is likely to re-enter the market.
Use Lower Time Frames for Timing
Once you’ve identified the stronger side of the market, the next step is to drill down into shorter-term charts.
This is where trade timing becomes important.
Instead of entering simply because the larger trend is bullish or bearish, wait for a technical setup that confirms the opportunity.
Examples include:
- A reversal pattern after a pullback
- A breakout from consolidation
- A support or resistance rejection
- A moving average bounce
- A trendline break
- The Amazing Trader Ladder Pattern or other proprietary setups
The lower time frame becomes your execution chart, not your decision-making chart.
Don’t Trade in a Bubble
Many traders become so focused on the chart directly in front of them that they lose sight of the overall market structure.
Trading this way is like trying to navigate a city by looking only one block ahead.
Before entering any trade, ask yourself:
- Is this move following the larger trend?
- Is it simply a correction?
- Which side of the market is less likely to have major stop-loss orders triggered?
- What are longer-term traders likely doing?
Answering these questions provides valuable context that can prevent low-quality trades.
Understand the Difference Between Trends and Corrections
One of the biggest advantages of drilling down is recognizing whether a move represents a genuine trend or merely a temporary correction.
For example, a 15-minute decline during a strong daily uptrend may simply be profit-taking before buyers step back in.
Conversely, a short-lived rally within a major downtrend may be nothing more than a bounce before selling resumes.
Understanding this distinction allows traders to stay aligned with the dominant market direction while avoiding emotional decisions.
The Goal Isn’t to Predict But to Improve Probability
Multiple time frame analysis doesn’t guarantee winning trades.
No trading strategy can eliminate risk.
Instead, drilling down helps traders identify which side of the market currently offers the highest probability based on the combined evidence across several charts.
By trading alongside longer-term momentum instead of fighting it, traders can improve both consistency and confidence.
To sum up, successful trading requires more than finding a signal on a single chart.
By drilling down through multiple time frames, traders gain valuable insight into the broader market structure, identify the dominant trend, and improve trade timing.
The process is straightforward:
- Start with the higher time frames.
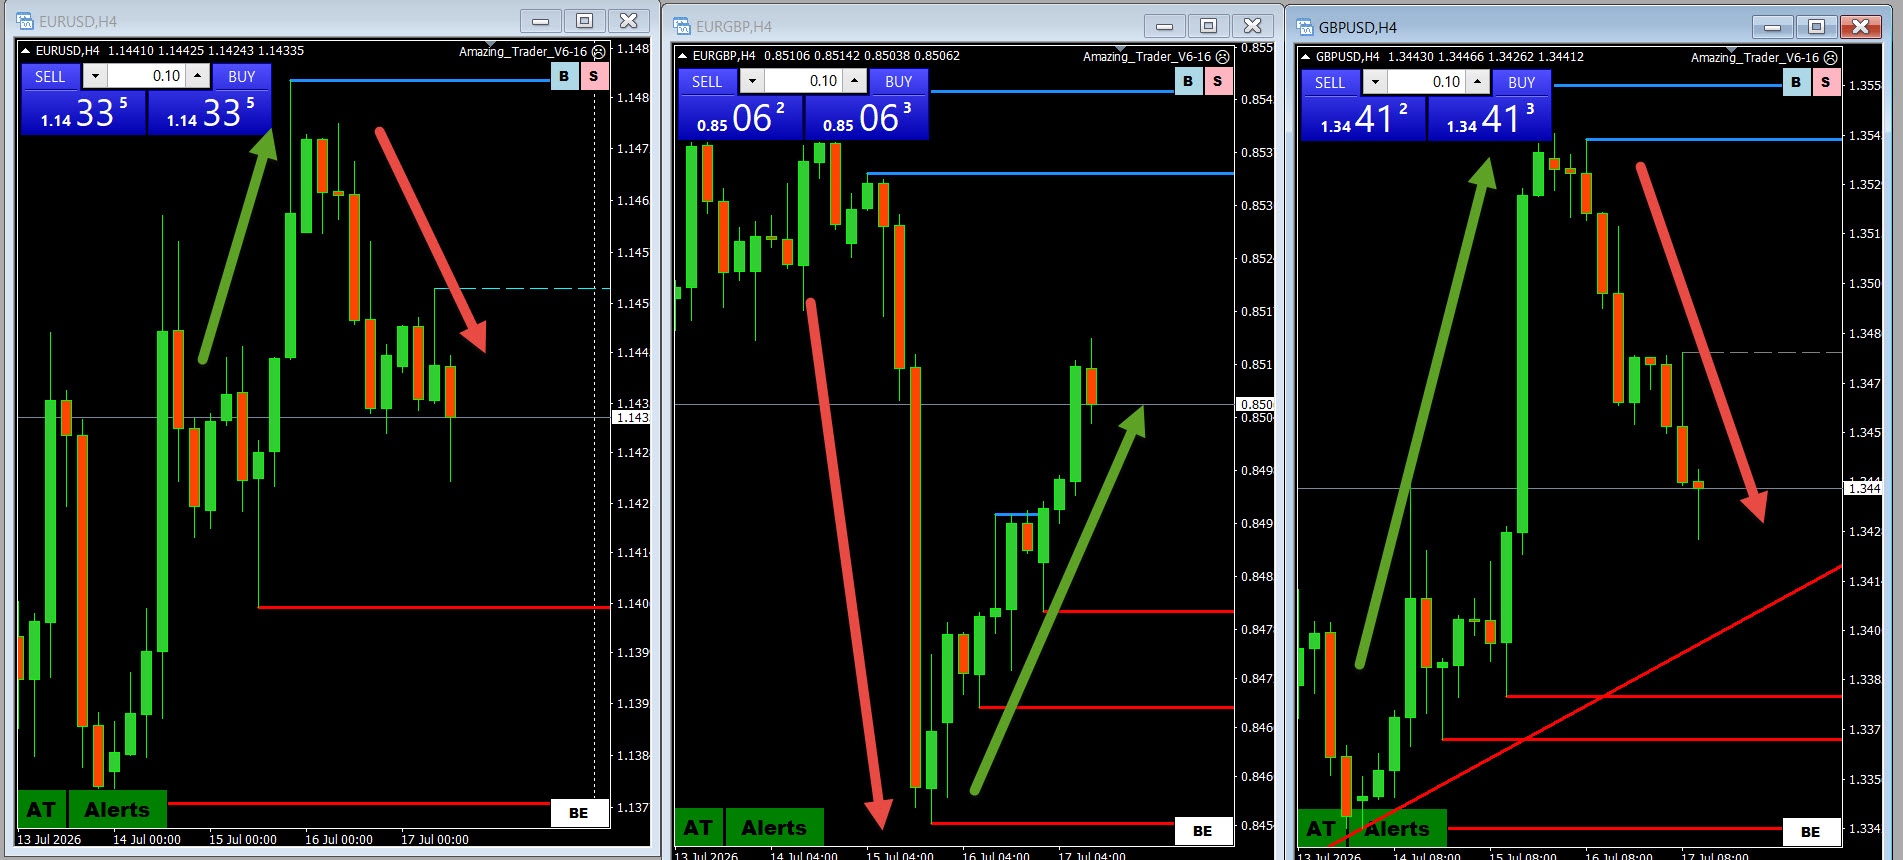
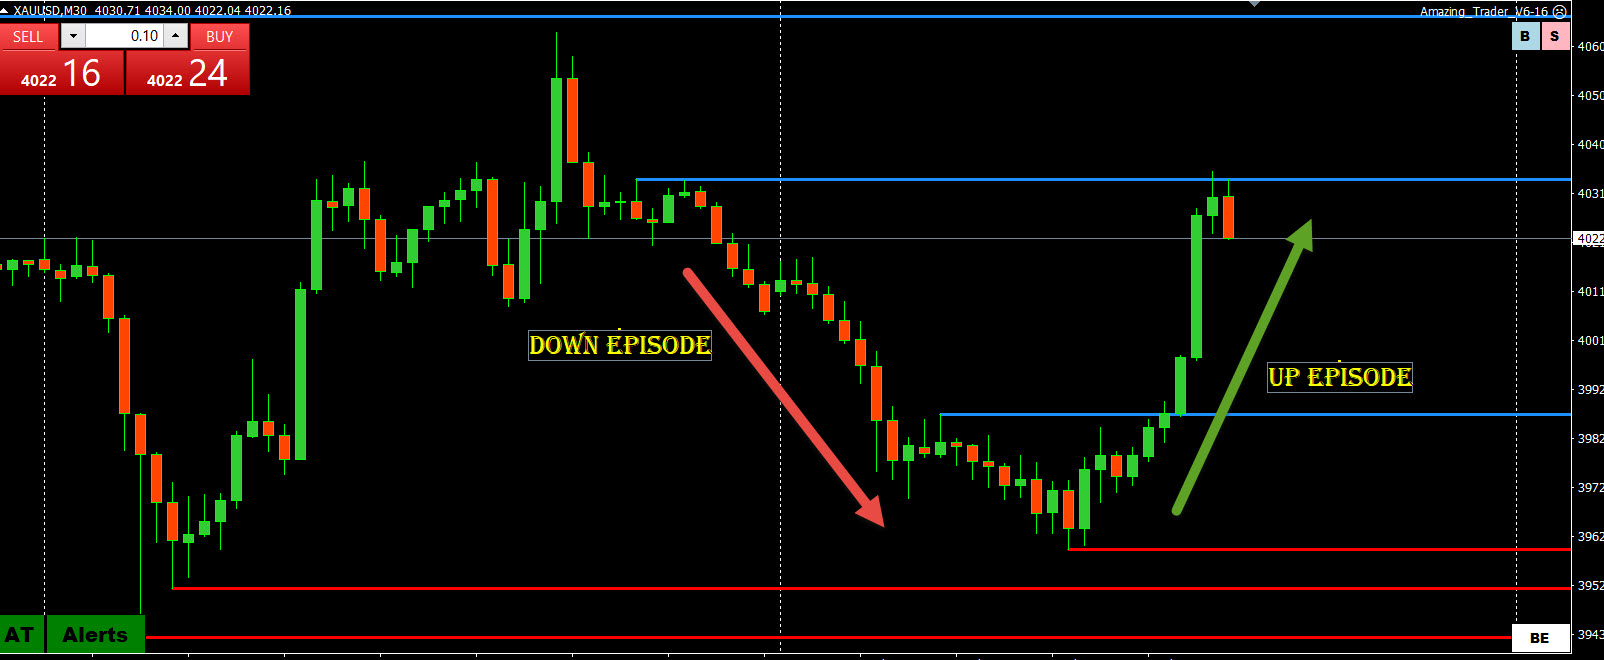
- Identify the dominant trend or market episode.
- Look for confirmation across multiple charts.
- Drill down to lower time frames for entry signals.
- Trade with, not against, the stronger side of the market. If the latter, look to take profits sooner rather than later.
The market is constantly changing, but one principle remains the same: the more time frames pointing in the same direction, the greater the probability that momentum will continue.
Don’t trade in a bubble. Step back, see the bigger picture, and let multiple time frame analysis guide your trading decisions.
Daily Tips
Test Plugin
About author

Add comment