
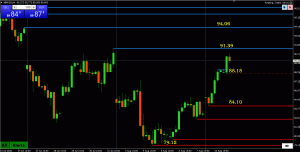
Trend: UP.
Momentum: UP, faces resistance
While this CFD chart may have different levels than you see on your chart, it’s is the pattern, showing up momentum that matters. Firmer oil fuels inflation expectations as reflected in firmer US bond yields.
On this chart, a break of 91.39 would expose 94.00.
Major level on this chart: 96.56
Keeps its bid while above 88.00, below cools it off.
Keep an eye on deadlines as that is what is moving price.
(AT CFD 4 hour chart)
Test Plugin
Add comment