
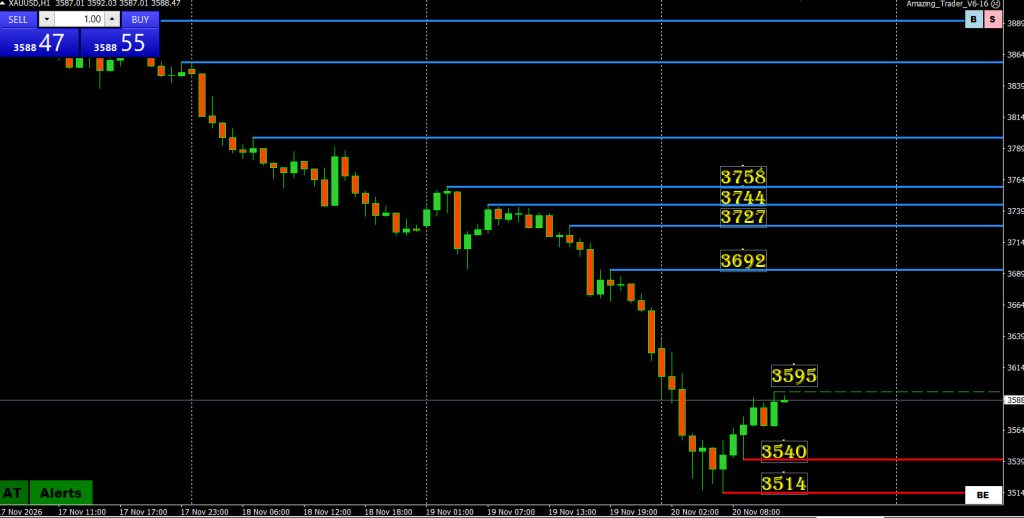
Gold’s selloff paused above the pivotal 3,500 round number, and the next pullback held at 3,540, above the 3,514 low. The two red Amazing Trader (AT) lines drawn off those lows form an AT Directional Indicator, flagging a potential change of direction. A break above 3,692 would confirm 3,514 as the low for now.
Resistance
3595 is minor resistance. It only gains significance if it repeatedly caps rallies as it’s the nearest level overhead.
The directional setup is a still distant 3692, the preceding lower high before the final leg of the selloff. There’s still around $100 between the minor resistance at 3,595 and the level that would confirm the low.
A break above 3,692 would interrupt the sequence of lower highs that has defined the decline. Further resistance is marked at 3727, 3744 and 3758.
Support
3540 is the first support and the higher low that gave rise to the AT setup. If gold pulls back and holds there again, the higher-low structure stays intact. A break below 3540 would weaken the setup and bring 3514 back into focus. A fresh low below 3,514 would invalidate the current pattern and expose ,500, just $14 below it.
The sequence is worth watching. The initial selloff stopped short of 3500, and the next dip found buyers at a higher price. That’s the first change in the hourly structure after a series of lower lows. How gold handles another pullback will show whether buyers can defend that improvement while the market works its way toward the much bigger test at 3692.
Addendum:
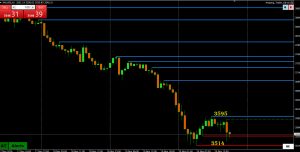
Higher AT lows setup broken as its Directional Indicator pattern was never confirmed.’
Price action suggests 3500 is being defended buit at risk unless 3595 is tasken out.