
US500 Weekly Low
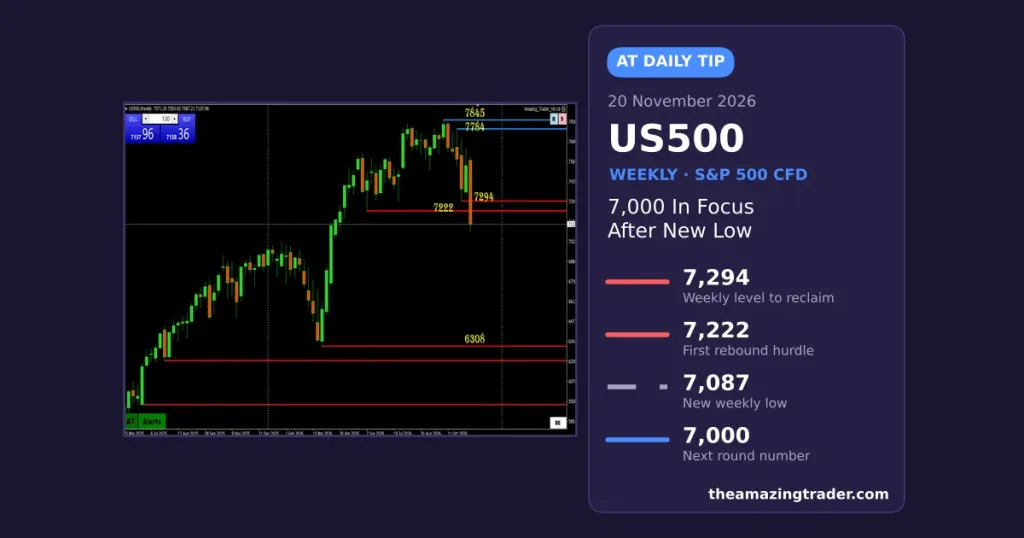
The US500 Weekly Low now sits at 7,087 on our AT chart. The index broke weekly support at 7,294 and 7,222 on the way down.
So round numbers matter more now. The first one to watch is 7,100, and 7,000 is only 87 points below the low.
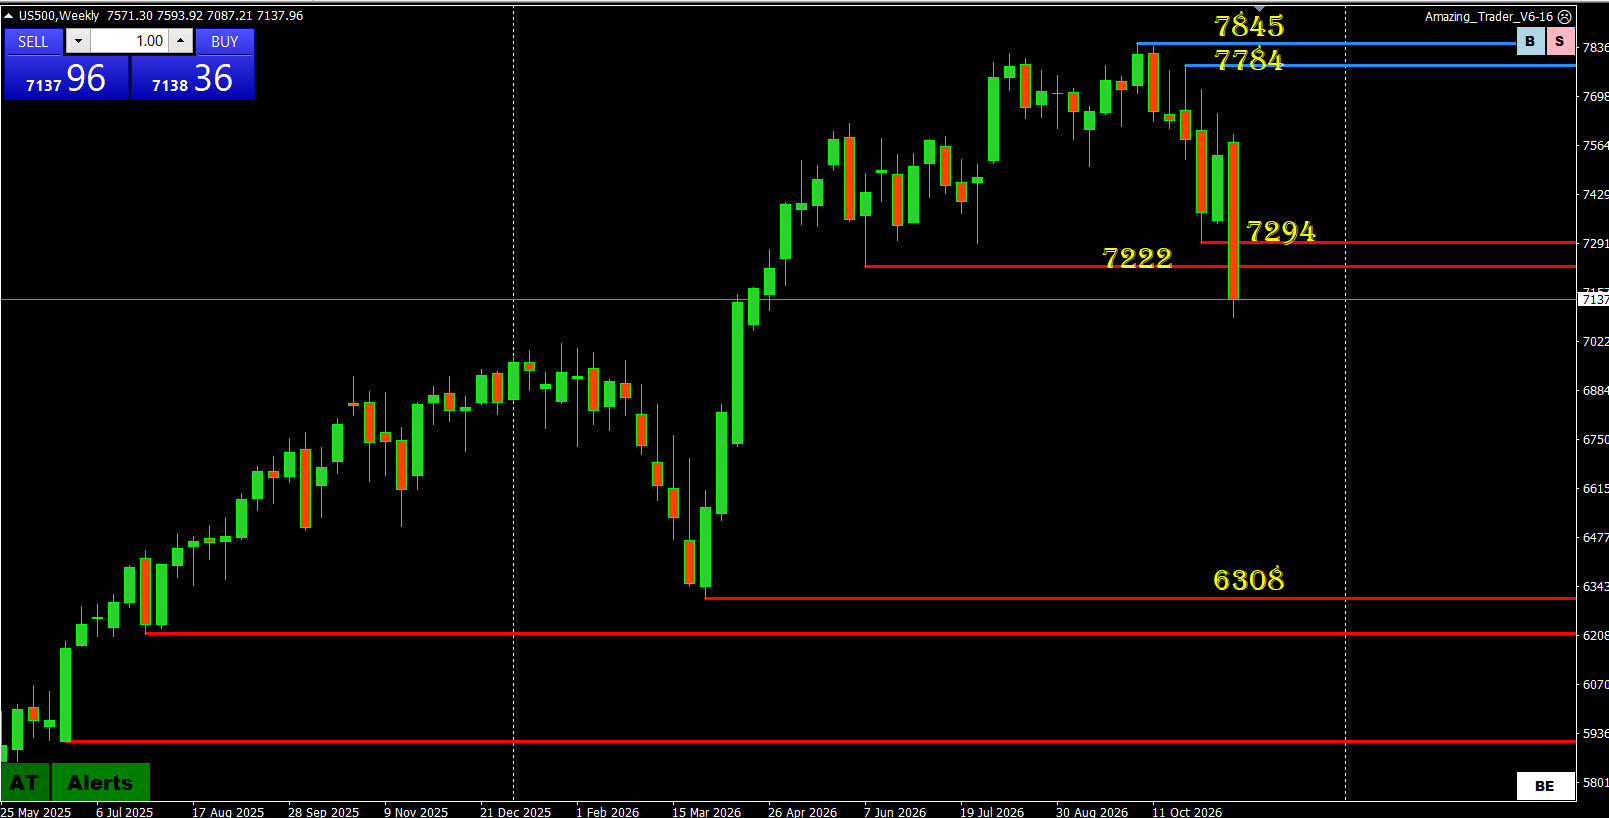
The next major AT support on the weekly chart is far lower, at 6,308. That is why a pause or bounce near 7,000 would be the first sign that buyers are soaking up the selling. However, a clean break would put 6,500 in view as a deeper round number. On a rebound, 7,222 and 7,294 are the first levels to win back. A weekly close above 7,222 would ease the pressure, while higher weekly resistance sits at 7,784 and 7,845.
The cash market opened split. In early trade the S&P 500 slipped 0.51% to 7,139.33. The Nasdaq lost 1.39%, yet the Dow rose 0.39% to 49,290.12. Meanwhile, the Russell 2000 fell 2.18%, and the VIX climbed to 29.46.
US500 Weekly Low
Chip stocks stayed under pressure. AMD fell 7.72% to $489.19, adding to Thursday’s drop after a short seller’s report on its China ties. Before the bell, Taiwan Semiconductor slid 4.2% after a sharp chip selloff in Asia. On the bright side, PDD jumped 11.04% on a profit beat, and Palo Alto Networks rose 6.42%.
US data gave a small lift. Consumer sentiment from the University of Michigan was revised up to 51.5 at 10:00 a.m. ET. The first estimate was 51.0, and October came in at 48.0.
Oil and bonds also moved. Brent dropped 3.71% to $88.57 and WTI lost 1.73% to $81.77, as export flows recovered and US crude stocks rose. Treasuries rallied, too, so the 10-year yield fell to 4.988% from 5.052%. As a result, the dollar index eased 0.19% to 103.70.
AT angle: a weekly picture like this is where a drill down starts. The higher time frames set the direction, and the lower ones time the entry. So a trader can start with the weekly and daily, then step down to the 4-hour, 1-hour and 15-minute charts. The more frames that agree, the stronger the momentum. Our AT software delivers its levels to MT4 charts in real time.
Next, watch how the US500 trades around the weekly low into Friday’s close, as monthly options expire today.
Disclaimer: This tip is for information and education only and is not investment advice. Trading forex, metals, indices and other leveraged products carries a high risk of loss. Always do your own research and only trade money you can afford to lose.