
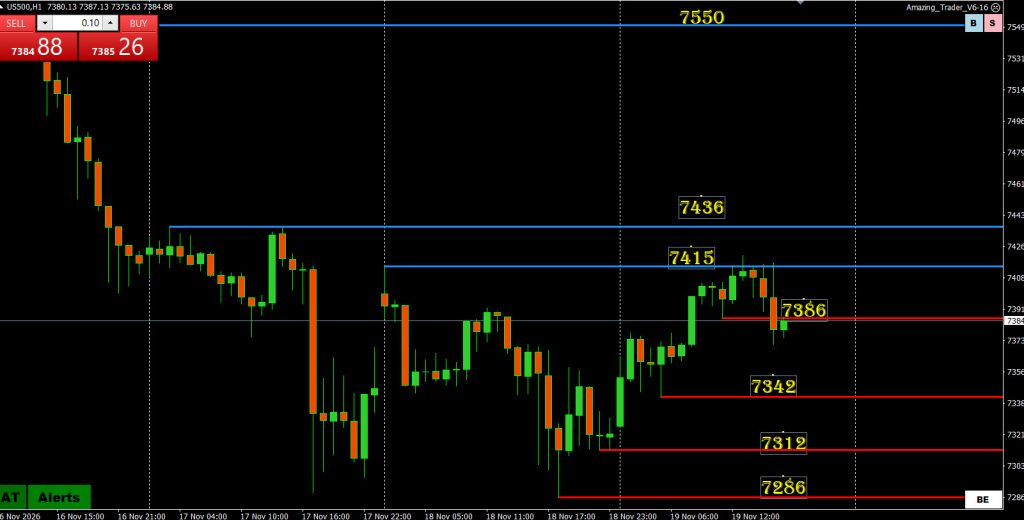
US500 briefly pushed above 7,415, the lower edge of the resistance zone flagged on the 1 and4-hour charts, before reversing and slipping through hourly support at 7,386.
That leaves the onus on the bulls to reclaim 7,386. Until they do, the focus shifts to 7,342, the next higher low on the hourly chart.
What the hourly chart adds
The rebound from around 7,286 built a series of higher lows at 7,312, 7,342 and 7,386. Those rising red Amazing Trader (AT) lines showed that buyers were stepping in at progressively higher levels. The break of the most recent line at 7,386 interrupts that sequence and makes the next pullback more important.
If 7,342 holds, the bulls still have a higher low to work with. A recovery back above 7,386 would put 7,415-21 back in play. If 7,342 gives way, the focus shifts to 7,312, followed by the swing low near 7,286. That low is the reference point for the entire rebound.
The resistance zone still matters
The move through 7,415 (high 7,421) was brief, and sellers reappeared before US500 could reach 7,436. That’s why I’d watch the two levels as a zone. The lower edge is where the latest rally ran into trouble. The upper edge is what buyers need to clear to ease the pressure visible on both the hourly and 4-hour charts.
A sustained break above 7,436 would open a wider gap to the next marked hourly resistance at 7,550. For now, the immediate question is whether buyers can defend 7,342 and reclaim 7,386.