
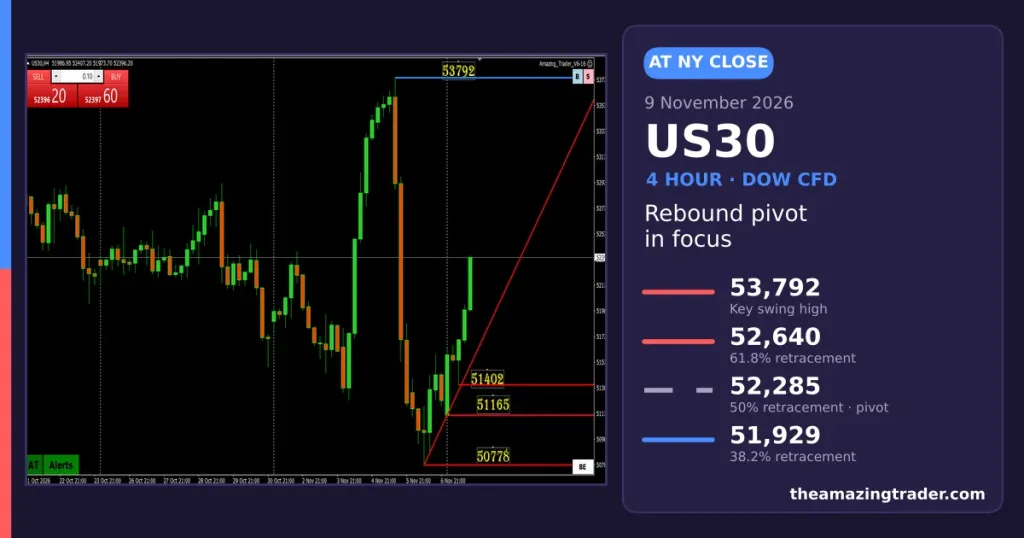
US30 Rebound Pivot
The Dow joined a broad rally on Monday. The blue-chip index closed up 1,104.02 points, or 2.15%, at 52,389.75. Meanwhile, the S&P 500 gained 2.35% and the Nasdaq rose 2.74%, as oil fell and chip stocks bounced.
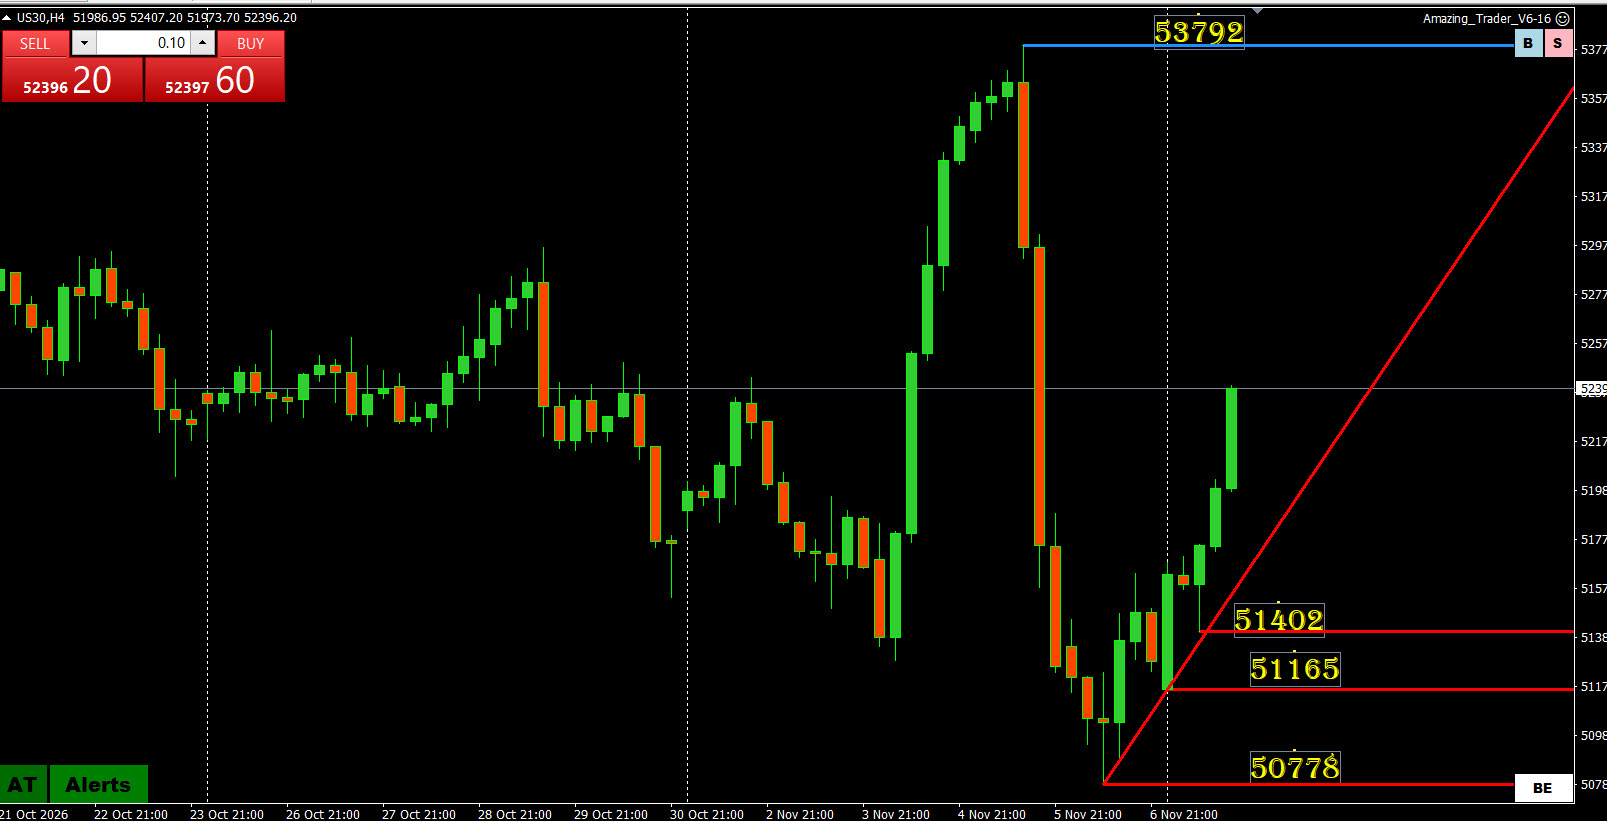
On our 4-hour US30 CFD chart, price has rebounded sharply from the 50,778 swing low. So far it has won back more than half of the drop from 53,792. A series of higher AT lows also points to better four-hour momentum.
However, the slide down was almost one-way. As a result, there is little nearby resistance, so we use retracement levels as the key reference points.
US30 Rebound Pivot
The near-term pivot is 52,285, the 50% retracement. While price holds above it, 52,640 (61.8%) stays in focus. Then a break above 52,640 would extend the recovery, with the 53,792 swing high next. Yet a drop back below 52,285 would bring 51,929 (38.2%) back into play. Below that, the AT higher lows sit at 51,402 and 51,165, and 50,778 is the key swing low.
AT angle: a move often speeds up after a third AT line turns solid, especially one drawn off the low. So traders can watch whether this rebound gains pace or stalls near 52,640. Tuesday’s October CPI report at 8:30 a.m. ET may decide that. You can follow these lines live with The Amazing Trader software.
Disclaimer: This tip is for information and education only and is not investment advice. Trading forex, metals, indices and other leveraged products carries a high risk of loss. Always do your own research and only trade money you can afford to lose.