

What is the EURUSD drill down analysis showing?
It shows 1 hour, 4 hour, daily and weelkly time frame charts all aligning
EURUSD WEEKLY: BREAKDOWN LEAVES A SUPPORT VOID
EURUSD’s break below 1.1065 weekly AT support, followed by 1.1000, reinforces the broader decline. Lower blue AT highs and the descending trendline keep momentum pointed down, with little marked weekly support before 1.0731.
That gap leaves room for further weakness, although pauses and rebounds can develop along the way. 1.1000 is the first recovery hurdle, followed by 1.1065, where former support becomes potential resistance.
A sustained recovery above those levels would ease immediate pressure, but 1.1272 remains the nearest confirmed blue weekly AT resistance. The current weekly candle is unfinished; buyers have yet to demonstrate a lasting turn.
EURUSD DAILY: FAILED RECOVERIES KEEP SELLERS IN CONTROL
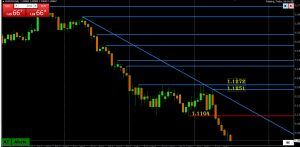
The daily chart confirms the weekly downside bias. Repeated failures beneath the descending trendline and lower blue AT resistance lines show buyers struggling to sustain recoveries. The break below 1.1104 daily support accelerated the decline through 1.1000, with price reaching 1.0960.
There is no confirmed daily AT support beneath the market on this chart (1.0800 is the next key round number), reinforcing the weekly void toward 1.0731. The current low is a reference point, not a confirmed AT level.
Buyers first need to reclaim 1.1000, then 1.1104, to ease pressure. 1.1251–1.1272 remains the key overhead daily AT resistance zone.
EURUSD 4 HOUR: LOWER AT HIGHS REINFORCE THE DECLINE

The four-hour chart aligns with the weekly and daily downside bias. Successively lower blue AT resistance lines show recoveries repeatedly failing, while price is testing and edging below 1.0968 support.
Sustained trading beneath 1.0968 (Tuesday low) would reinforce the breakdown, with no further confirmed AT support visible on this chart. A quick recovery above it would suggest sellers are struggling to follow through, but buyers still need to regain 1.1000.
The nearest blue AT resistance line is labeled 1.1030 (1.1023 is also a resistance). Above that, 1.1063 and 1.1103 remain recovery hurdles.
EURUSD 1 HOUR: BOUNCES STRUGGLE TO GAIN TRACTION
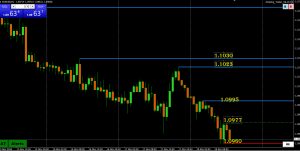
The hourly chart completes the drill-down with momentum also pointed down. The bounce from 1.0960 has stalled beneath 1.0977, where a dashed resistance line remains provisional pending confirmation.
Holding 1.0960 keeps another recovery attempt possible, but a sustained break would extend the decline with no further AT support visible below. Buyers need to clear 1.0977, followed by confirmed resistance at 1.0995 and pivotal 1.1000, to ease immediate pressure.
Until those hurdles break, rebounds remain vulnerable. The alignment of hourly weakness with the four-hour, daily and weekly charts reinforces sellers’ control across the timeframes.