

Indices breaking down yesterday has seen lows extended today but so far with limited follow through
Let’s take a look at the US500 and NAS100 outlook.
US500 4 HOUR OUTLOOK (CFD)
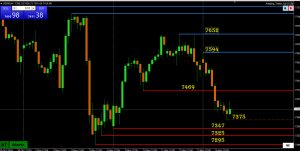
The break below 7469 has followed through, keeping momentum pointed down beneath the lower blue AT resistance lines at 7594 and 7652. Former support at 7469 now becomes the first important recovery hurdle.
The latest decline reached 7375, where a dashed AT support line is developing but remains provisional pending price-action confirmation. Holding this low could allow a bounce, but buyers need to reclaim 7469 to suggest the immediate selling pressure is easing.
Below 7375, attention shifts to 7347, followed by 7325 and 7295. This cluster gives buyers potential support, but repeated weak rebounds would leave those levels vulnerable to further tests.
For now, the bounce represents an attempt to stabilize within the decline. Above 7469 would improve the near-term picture, while clearing 7594 would interrupt the latest sequence of lower confirmed AT highs.
Support: 7375 (intra-day low), 7347, 7325, 7295.
Resistance: 7469, 7594, 7652.
NAS100 4 HOUR OUTLOOK (CGD)

Yesterday’s breakdown below 27405 has followed through, with NAS100 reaching 26997 before attempting a recovery. The sequence of lower blue AT resistance lines keeps momentum pointed down, leaving buyers needing to prove that the bounce can develop beyond a temporary pause in the selling.
27405–27410 is now the pivotal resistance zone. Yesterday’s broken support at 27405 sits almost directly beneath the latest confirmed blue AT resistance at 27410. That overlap makes this area particularly important: failure to reclaim it would leave the breakdown intact and the rebound vulnerable to renewed selling.
The latest low at 26997, just beneath the psychological 27000 level, has produced a dashed AT support line. This remains provisional until the price-action pattern is confirmed. The initial bounce shows buying interest, but buyers need to move price away from this area and break overhead resistance to strengthen the case for a recovery.
A sustained break below 26997 would expose 26639, followed by 26244. The gap to the next confirmed AT support at 26639 leaves room for another meaningful decline if sellers regain momentum. A brief dip below 27000 followed by a quick recovery would carry a different message from a break that holds and extends.
On the upside, regaining 27405–27410 would be the first sign that the breakdown is losing its grip. Beyond that, 28188 is the next marked AT resistance, followed by 28587 and 28909. Clearing 27410 would interrupt the most recent sequence of lower AT highs, but the higher resistance levels would still challenge a broader recovery.
For now, 26997–27000 is the immediate downside obstacle, while 27405–27410 determines whether the bounce can gain traction.
Support: 27000–26997 (AT line provisional), 26639, 26244.
Resistance: 27405–27410, 28188, 28587, 28909.