
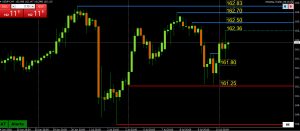
What stands out on this chart is a bounce from a double bottom just above 161.25 support.
On the other side, for momentum to buil;d to the upside, 161.80 needs tyo hold as support followed by a break of 162.25.
To put the 40 year high at 162.83 in play again, 162.50 would need to be broken.
(AT 4 hour chart)
Test Plugin
Add comment