
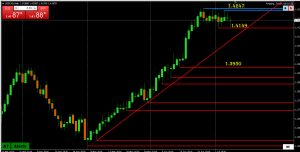
AT (Amazing Trader) daily chart shows 1,42 trading for the 12th day in a row.
Range over this period have been 1.4149-1.4247.
Currently, USDCAD testing the downside off the back of firmer oil prices, so far with limited follow through (low 1.4155).
To break the current patter, needs 1.42 not to trade tomorrow and 1,4149 firmly broken. Otherwise, pattern continues.
Watch 1.42 and whether correlation with oil prices continues.
Test Plugin
Add comment