
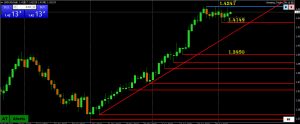
Itching for a breakout.
Current pattern: 1.42 has traded in each of the past 11 days (including today). The longer this pattern goes on the greater the risk of a directional move in the direction of the breakout once the pattern ends.
Range over this period has been around d 1.4150-1.4250 (actual 1.4149-1.4247)
If 1.42 fails to print and becomes resistance, then risk is for a move to 1.3950-1.4000, assuming 1.4150 is firmly broken.
If 1.42 fails to print and becomes support, risk is for 1.4415 with potential for 1.4500-50, assuming 1.4250 is firmly broken.
In any case, market will take its cue from whether 1.42 becomes support or resistance.
Test Plugin
Add comment