
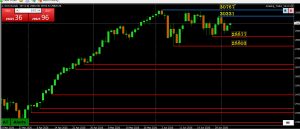
While the bounce from just below 29K is encouraging, a solid move above 30K is needed to put the bulls back into control.’
Otherwise, it is still consolidation while trade is between 29-30K.
Note, this chart is from a CFD feed, which can vary between brokers, even with the same symbol. Same for CFDs vs. cash of futures prices. However, while your levels may differ from this chart, the patterns you see should look similar on your chart.
Test Plugin
Add comment