
NAS100 4 HOUR OUTLOOK (CFD)
Nvidia’s earnings and anticipation ahead of the Anthropic IPO are providing some support, but NAS100 has slipped from its earlier high. The rebound from 26573 has lifted price away from the lows without yet breaking the overhead AT resistance structure.
27411–27526 is the immediate resistance zone to watch. The former sits close to the earlier 27405 breakdown level, making this area important in judging whether buyers can reverse the damage. A sustained move above 27526 would strengthen recovery prospects and open room toward 28188, followed by 28589.
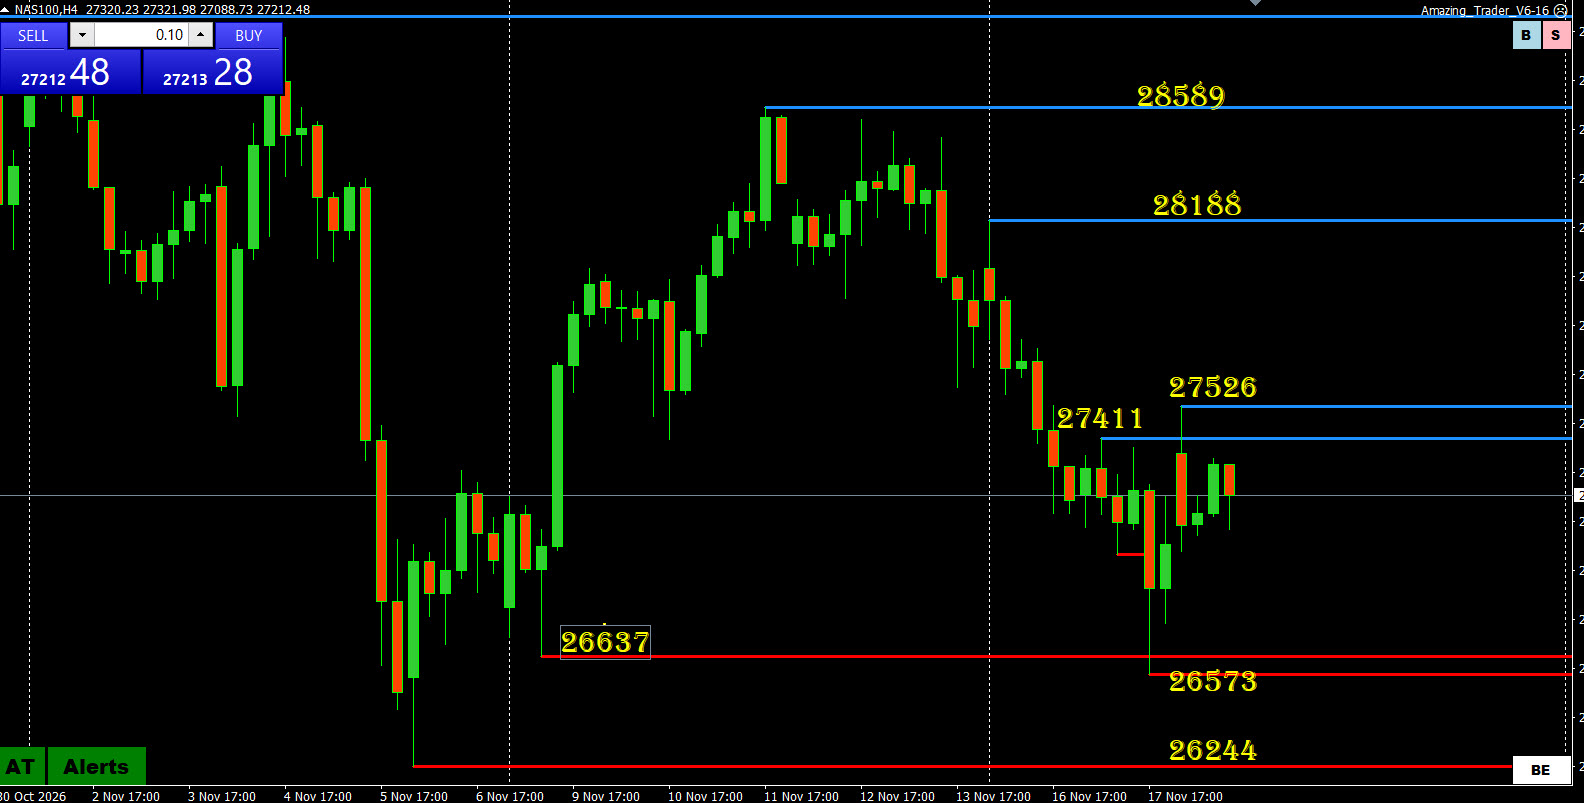
Until those nearby hurdles are cleared, the bounce remains vulnerable within the broader decline. Positive news can trigger buying, but buyers need to sustain that demand and turn resistance into support.
On the downside, 27000 provides an immediate round-number reference. Below it, attention returns to 26637–26573. The dip through 26637 failed to extend toward 26244, and the subsequent recovery gives buyers a foothold. However, another sustained break below 26573 would undermine that recovery and expose 26244, the next major marked support.
The key question is whether the news-supported rebound can produce follow-through. Holding above the recent lows keeps recovery hopes alive; clearing 27411–27526 would give those hopes stronger technical backing.
Support: 27000, 26637, 26573, 26244.
Resistance: 27411, 27526, 28188, 28589.
US500 4 HOUR OUTLOOK (CFD)

US500’s recovery from 7288 has lifted price back above the former 7295 low, but buyers have yet to break the sequence of lower AT resistance levels. The rebound has stalled beneath 7392, leaving the immediate recovery vulnerable.
The dip below 7295 failed to produce sustained follow-through, giving buyers an initial foothold. However, holding the lows and reversing the decline are separate steps. Sellers continue to cap rebounds, with confirmed blue AT resistance at 7415 and 7436 above the developing 7392 level.
Buyers need to sustain a move through 7436 to provide stronger evidence that the recovery is gaining traction. Beyond that zone, the next marked resistance is considerably higher at 7594, followed by 7652.
On the downside, the 7344 area, the current candle’s low, provides a nearby reference rather than confirmed AT support. Renewed weakness beneath it would shift attention back toward 7295–7288. A sustained break below 7288 would invalidate the recent recovery attempt and extend the decline beyond the marked lows.
For now, the chart shows a bounce from a failed downside break, but no confirmed reversal of the broader bearish structure. Watch whether buyers can build on the recovery or whether another lower high sends price back toward support.
Support: 7344 area (intrabar low), 7295–7288.
Resistance: 7392 (provisional), 7415, 7436, 7500, 7594, 7652.
US30 4 HOUR OUTLOOK (CFD)

US30 remains under pressure, with the descending trendline and successive lower blue AT resistance lines keeping momentum pointed down. The latest decline reached 50557, but the recovery has struggled beneath 50939, leaving price hovering near its lows.
50557 is the immediate support to watch. Holding it keeps another bounce possible, but buyers need to move the market away from this area. Repeated shallow recoveries would leave support vulnerable to another test.
A sustained break below 50557 would expose a 48500–50000 support zone, with the psychological 50000 level marking its upper boundary. The lack of nearby confirmed AT support leaves room for further weakness if sellers follow through
On the upside, clearing 50939 would interrupt the latest sequence of lower AT highs and ease immediate pressure. However, 51471 remains the next significant resistance, with the descending trendline also overhead. A sustained recovery through that area would provide stronger evidence that buyers are regaining control.
For now, the chart shows stabilization rather than a confirmed reversal. Holding support is the first step; breaking resistance is what would give the recovery traction.
Support: 50557, 50000 (psychological).
Resistance: 50939, 51471, descending trendline.