

One of the biggest mistakes traders make is focusing on a single chart while ignoring the bigger market picture.
Whether you’re trading a 5-minute, 15-minute, 1-hour, or 4-hour chart, relying on just one time frame can lead to poor trade selection and unnecessary losses.
Professional traders rarely make decisions based on a single chart. Instead, they use multiple time frame analysis, often referred to as drilling down, to identify the strongest side of the market before looking for an entry.
- Daily: Broad trend and major levels, including weekly resistance.
- 4-hour: Whether the developing structure supports the daily trend or signals a correction.
- 1-hour: Immediate momentum and nearby levels.
USDCAD DAILY: STRONG ADVANCE MEETS 1.4300
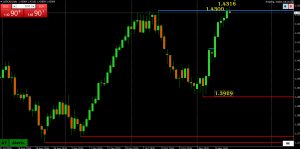
USDCAD’s rally from 1.3929 has reached the pivotal 1.4300 area, with the latest push topping at 1.4316 before slipping back. Buyers have driven the broader advance, but they now need to sustain a breakout.
Above 1.4316, weekly resistance stands at
USDCAD’s rally from 1.3929 has reached the pivotal 1.4300 area, with the latest push topping at 1.4316 before slipping back. Buyers have driven the broader advance, but they now need to sustain a breakout.
Above 1.4316, weekly resistance stands at 1.4413, followed by 1.4542 and 1.4793. Failure at the current highs would leave room for a correction, with the shorter charts providing support levels well before 1.3929, the nearest marked daily AT support.
Support: 1.3929.
Resistance: 1.4300–1.4316, 1.4413, 1.4542, 1.4793.
USFCAD 4 HOUR: HIGHER AT LOWS KEEP BUYERS IN CONTROL

The rising sequence of red AT support lines supports the daily advance. The pullback from 1.4316 has so far left 1.4270 intact, keeping the immediate four-hour structure pointed higher.
Below 1.4270, attention shifts to 1.4224. A break there would interrupt the latest sequence of higher AT lows and expose a sizable gap toward 1.4099–1.4077.
While these supports hold, the retreat remains a correction within the advance. Buyers still need to clear 1.4300–1.4316 to resume upside progress.
Support: 1.4270, 1.4224, 1.4099, 1.4077.
Resistance: 1.4300–1.4316.
USDCAD 1 HOUR: EARLY SIGNS OF A PAUSE
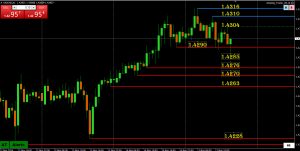
The one-hour chart shows the first signs of momentum cooling, with a lower AT high at 1.4310 beneath 1.4316. The dashed level at 1.4304 remains provisional.
The dip through 1.4290 reached 1.4285 before recovering, leaving sellers needing follow-through. Below 1.4285, support steps down through 1.4276, 1.4270 and 1.4263, with 1.4228 further below.
Buyers need to regain 1.4300–1.4304, then clear 1.4310–1.4316, to restore immediate upside momentum.
The drill-down shows a strong broader advance with a shorter-term pause. Whether the hourly weakness extends through 1.4270 will help determine if that pause becomes a deeper four-hour correction or not.
Support: 1.4290, 1.4285, 1.4276, 1.4270, 1.4263, 1.4228.
Resistance: 1.4300–1.4304, 1.4310, 1.4316.
.