
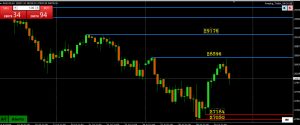
Textbook Amazing Trader ladder pattern here as well:
- 2 red lines drawn off the low = an AT directional Indicator pattern (indicating potential change in direction)
- Move up confirmed a break of momentum and shift in risk but pause below 28596.cools the upside unless broken.
- This leaves NAS100 dependent on 28+ trading to keep a bid but above 28596 would be needed to shift the focus to 29K+.
(AT 4 hour chart)
Test Plugin
Add comment